

0 引言
可靠性鉴定试验的目的是验证产品的设计是否达到了规定的可靠性要求。一般是根据大纲中选定的抽样方案,抽取有代表性的产品在规定的条件下所进行的试验,用于设计定型或者重大技术变更后的鉴定。
可靠性鉴定试验的统计方案主要包括序贯试验方案、定数截尾试验方案和定时截尾试验方案[1]。李根成[2]介绍了如何确定可靠性试验的检验下限和检验上限,定量分析了可靠性指标达到规定值的产品通过试验的概率。汪亚顺等[3]研究了机电设备可靠性验证试验统计方案,推导了指数分布和威布尔(Weibull)分布场合接收概率方程组,并给出了两种分布情况下生产方风险和使用方风险与样本量的关系。崔卫民等[4]针对威布尔分布时可靠性试验最少试件数的确定进行了分析,可降低试验周期及费用。李海波等[5]对GJB 899—1990中定时试验方案和序贯试验方案进行了分析,得出表A7和表A8适用于技术状态不变产品的可靠性试验结果的评定。傅慧民等[6]提出了一种威布尔分布定时无失效数据可靠性分析方法,在形状参数下限已知的情况下,给出了可靠度和使用寿命的单侧置信下限,从而能够根据定时无失效数据对产品进行高置信水平的可靠性评定。张勇波等[7]提出了一种威布尔分布定时无失效数据疲劳寿命分散系数修正方法,定义了定时无失效数据情形下分散系数的修正系数,推导了其计算公式。刘海涛等[8]在威布尔分布场合下,由函数凹凸性获得了各时刻失效率之间的关系,利用先验信息得到了各时刻的失效概率的Bayes估计。张点等[9]针对GJB 899A—2009中的试验方案试验时间过长或试验风险过大,利用Bayes方法基于产品试验数据获取寿命分布,从而计算产品可靠性试验方案中的双方风险,确定满足风险要求的可靠性鉴定试验方案。
随着科技的进步,复杂机电产品的可靠性水平越来越高,产品无故障情况越来越普遍,针对产品的寿命和平均故障间隔时间等可靠性指标,通常需要在产品状态鉴定阶段开展可靠性鉴定试验与指标评估。当前在工程中应用最多的是基于寿命服从指数分布,但是指数分布主要适用于电子产品[10-16]。而复杂机电产品的寿命分布主要为威布尔分布,当前对产品的威布尔分布模型研究较少,尤其是针对无故障数据产品的威布尔模型参数取值相对困难[17],因此一定程度上也限制了其在产品鉴定中的应用。文中以典型复杂机电产为对象,开展基于无故障数据威布尔分布的模型研究及可靠性鉴定试验方案研究,通过与传统的基于指标分布的可靠性鉴定试验方案及指标评估对比分析,为同类产品可靠性鉴定试验方案确定及指标评估提供依据。
1 产品威布尔分布无故障数据建模
假设产品寿命服从式(1)所示的两参数威布尔分布:
F(t)=1-exp
式中:m为形状参数;η为尺度参数。
在l次定时结尾试验中,产品累计工作时间为t1≤t2≤t3≤…≤tl时未出现故障,相应累计时间内的试验样品数为n1,n2,…,nl,则称(ti,ni)为无故障数据,i=1,2,…,l。
根据式(1)模型,可得到如下信息:
1)记pi=P(T<ti)=F(ti),i=1,2,…,l,则可得p1≤p2≤…≤pl;
2)在t=0时,产品的故障率为p0=P(T=0)=0;
3)记si=ni+ni+1+…+nl,表示在ti时刻有si个样品参加试验,且无故障,则无故障数据可以记为(ti,si),i=1,2,…,l。
2 无故障数据威布尔分布模型计算
2.1 故障率先验分布的确立
产品寿命T服从威布尔分布,则其故障概率函数为:
λ(t)= =
工程实际中,多数产品的故障率都是随时间的增加而不减,即λ(t)为非减函数。
产品可靠度函数R(t)可表示为:
$R(t) \triangleq-\ln R(t)=\left(\frac{t}{\eta}\right)^{m}$
当m>0,由凹函数性质及lnR(t0)=0,对于∀1≤i≤l有:
(R(ti) ≥(R(tl) ,i=1,2,…,l
代入pi表述式可得:
0≤pi≤1-
式(5)表示了该样本总体的失效概率pi的特性,可在pi计算Bayes估计过程中将其当作先验信息。
在对无故障数据进行分析时,未给出有关失效概率分布的情况,根据Bayes假设,可将[0,λl]上的均匀分布当成pl的先验分布[18]:
πl(pl)=
由pl的先验分布,可以推导出pi(i=1,2,…,l-1)的先验分布:
0≤pi≤1- ,
在工程实际中,对于不同时刻失效概率的关系无法直接应用到计算过程中,在此提出假设,构造pi和pl的关系[11]:
pi=1- ,i=1,2,…,l-1
式(8)中失效概率pi和pl的关系是保守的,但在工程中容易使用,根据式(8)和先验分布公式可以得到:
由式(9)得到pi的先验分布呈递减趋势。
2.2 故障率贝叶斯统计推断
通过计算出的各时刻失效概率的先验分布,可对失效概率pi进行Bayes估计。
∀1≤i≤l,si个产品在时刻ti截止时未发生故障,则在ti时刻可得到故障率的似然函数为:
L(pi)=(1-pi
令ri=si+tl/ti-1,λi=1-(1-λl ,根据先验公式可推导pi的后验分布为[8]:
πi(pi )= dpi, 0<pi<λi
通过平方损失的计算方法,可得pi的贝叶斯估计为:
= piπi(pi )dpi=
2.3 威布尔分布模型参数确定
在完成pi的贝叶斯估计后,即可得到各时刻的故障率(ti,pi),对各点拟合出威布尔分布曲线:
pi=P(T≤ti)=1-exp
利用最小二乘法进行参数拟合[19],并令:
E(m,η)=
以满足:
E(, )= E(m,η)
由此可得到产品的可靠度的估计值为:
(t)=exp
3 威布尔分布可靠性试验方案设计
对于服从威布尔分布的可修产品定时截尾的试验方案设计如下,对于两参数威布尔分布,令λ= ,T=tm,则变量T服从故障率为λ的指数分布。若已知样本量n,那么在时间(0,t]内发生故障的故障总数的概率为:
L(θ)= exp(-nλt)
由威布尔分布模型的期望θ=ηΓ 和λ= 可得:
λ=
由产品的抽样特性曲线和泊松过程的统计推断可得:
进一步可得:
dm=
式中:α和β分别为生产方风险和使用方风险;d为鉴别比;m为威布尔分布的形状参数;c为允许故障数。
对于可修产品在时间(0,t]内故障次数记为S(t),数学期望为E(S(t)),其故障次数服从期望为E(S(t))的非齐次泊松过程[18]。所以,n个产品产生的故障数r不大于允许故障数的概率为:
L(θ)= exp(-nE(S(t)))
对于故障间隔时间服从威布尔分布,其累计故障次数的数学期望为E(S(t))为:
E(S(t))≈ +
式中:θ为故障间隔时间的期望;σ2为故障间隔时间的方差[18]。由σ2=η2 ,可得:
E(S(t))= + -1
根据上述公式可得:
t= θ
根据产品抽样特性曲线,可得:
为了减少误差,取均值作为试验时间:
t= θ1
4 工程案例
文中观瞄装置是复杂的机电产品,由光电转塔、位置传感器、升降桅杆及连接电缆等组成。安装于运载车顶部,主要功能是完成目标搜索、测距和跟踪等功能。
表1 无故障数据统计Table 1 Zero-failure data statistics |
| Serial number | ti/h | ni | si |
|---|---|---|---|
| 1 | 95 | 2 | 7 |
| 2 | 105 | 1 | 5 |
| 3 | 120 | 1 | 4 |
| 4 | 135 | 1 | 3 |
| 5 | 142 | 1 | 2 |
| 6 | 153 | 1 | 1 |
观瞄装置的平均故障间隔时间最低可接受值θ1为500 h,规定值θ0为750 h。
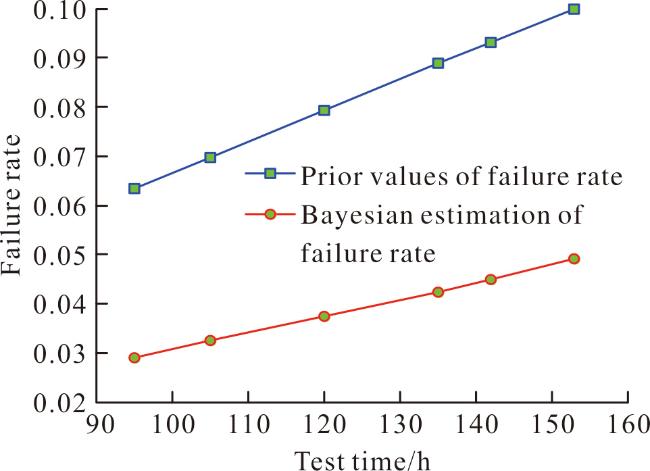
表2 各时刻的故障率先验值Table 2 Prior values of failure rates at each moment |
| Parameter | λ1 | λ2 | λ3 | λ4 | λ5 | λ6 |
|---|---|---|---|---|---|---|
| Value | 0.063 3 | 0.069 8 | 0.079 3 | 0.088 8 | 0.093 2 | 0.100 0 |
表3 各时刻故障率的贝叶斯估计Table 3 Bayesian estimation of failure rate at each moment |
| Parameter | ||||||
|---|---|---|---|---|---|---|
| Value | 0.029 0 | 0.032 6 | 0.037 3 | 0.042 2 | 0.045 0 | 0.049 1 |
通过对产品各时刻故障率的贝叶斯估计值进行最小二乘拟合,利用式(14)求得威布尔分布参数m和η的估计值为 =1.1088, =2280.1。根据威布尔模型和指数模型进行计算可得,当时间t<2280 h时,服从威布尔分布的可靠度大于指数分布的可靠度;当时间t>2280 h时,服从威布尔分布的可靠度小于指数分布的可靠度,如图2所示。
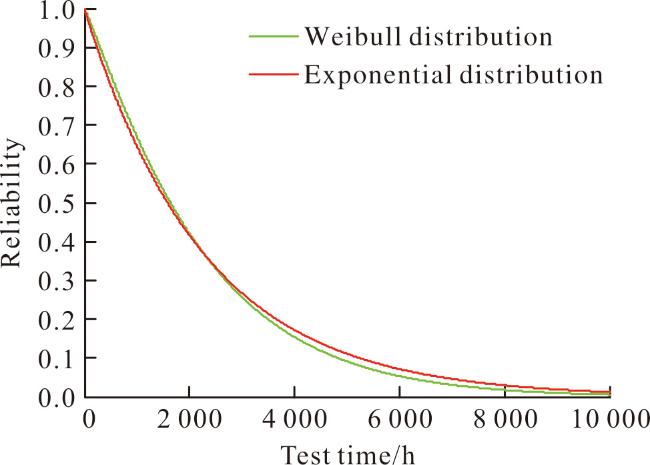
表4 威布尔分布可靠性鉴定试验方案(鉴别比d=1.5)Table 4 Reliability evaluationtest scheme of Weibull distribution (identification ratio d=1.5) |
| Scheme | Allowable number of failures | Nominal risk/% | Actual risk/% | Test time/h | ||
|---|---|---|---|---|---|---|
| User's | Producer's | User's | Producer's | |||
| 1 | 32 | 10 | 10 | 31.22 | 1.36 | 1 891 |
| 2 | 13 | 20 | 20 | 29.58 | 12.01 | 1 246 |
| 3 | 5 | 30 | 30 | 33.66 | 25.11 | 547 |
表5 指数分布可靠性鉴定试验方案(鉴别比d=1.5)Table 5 Reliability evaluation test scheme of exponential distribution (identification ratio d=1.5) |
| Scheme | Allowable number of failures | Nominal risk/% | Actual risk/% | Test time/h | ||
|---|---|---|---|---|---|---|
| User's | Producer's | User's | Producer's | |||
| 1 | 39 | 10 | 10 | 10.17 | 10 | 3 450 |
| 2 | 17 | 20 | 20 | 19.43 | 20 | 1 535 |
| 3 | 6 | 30 | 30 | 29.95 | 30 | 578 |
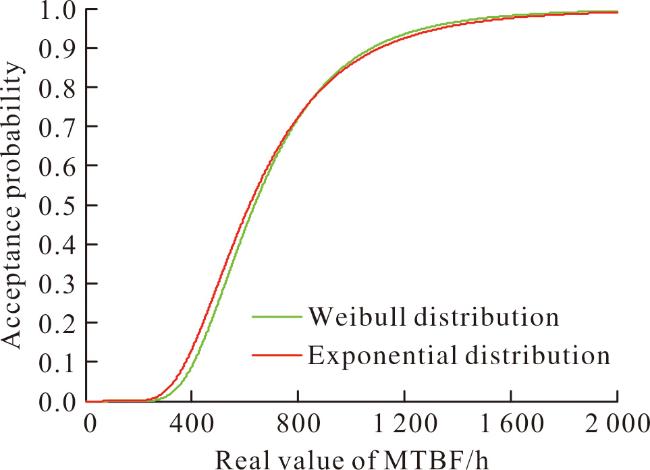
按照威布尔分布和指数分布试验方案考核时,产品的接收概率如图3所示,当产品的MTBF的真值大于841 h时,威布尔分布试验方案的接收概率大于指数分布的接收概率;当产品的MTBF的真值小于841 h时,威布尔分布试验方案的接收概率小于指数分布的接收概率。


5 结论
针对当前无故障数据复杂机电产品威布尔可靠性鉴定试验方案参数难以确定,可靠性试验方案仍然以GJB 899A—2009标准中的指数分布为主,无法准确评定产复杂机电产品的可靠性试验水平。提出了基于无历史故障数据的威布尔可靠性鉴定试验方案确定方法,依据两参数威布尔模型和历史数据信息计算故障率先验信息,采用贝叶斯统计推断获得故障率后验信息,最后通过最小二乘法获得威布尔分布参数估计,并进行可靠性鉴定试验方案计算。以典型观瞄装置无故障数据分析为例,进行了可靠性鉴定试验方案设计,并与GJB 899A—2009中的方案进行了对比分析,整体威布尔分布试验方案要严于指数分布试验方案,其中威布尔高风险试验方案较指数分布试验方案,MTBF单侧置信下限准确度提高了9.2%,所建立的基于无故障数据的威布尔分布可靠性鉴定试验方案有效,可直接应用于复杂机电产品可靠性鉴定试验方案的制定。