

0 引言
在现代防空作战中,战场形势瞬息万变,战机性能的提升以及防空设备种类众多等因素给防空设备部署带来了巨大的挑战。作为整个防空体系的核心环节,地面防空设备部署方案的优劣直接关系到防空作战效果[1]。因此,构建一套既能适应复杂战场环境,又能高效应对空中威胁的地面防空部署方案,对于提升现代防空作战能力至关重要。
虽然文献[2-7]对防空部署进行了研究,但基于信息化、智能化的现代防空作战对部署方案的时效性提出了更高要求,亟需进一步研究解决。为改善时效性,人工蜂群(artificial bee colony, ABC)算法备受关注[8-9]。ABC算法具有结构简单、易于实现、不易陷入局部最优的特点,兼备强大的搜索能力,在防空部署中得到了较为广泛应用[10-12]。在优化部署武器系统方面,文献[10]提出一种基于改进遗传蜂群算法优化部署模型。针对防空作战部署方案产生速度慢、不符合战场实际环境问题,文献[11]提出一种基于简化ABC算法的地面防空设备部署方法。通过改进ABC算法,文献[12]实现对地面分队防御作战兵力部署的建模和优化。尽管文献[10-12]的ABC算法在部署优化问题上展现出了一定的优势,但随着现代防空作战中战机性能提升、智能化程度改善等,其ABC算法面临时效性问题,亟待进一步优化。
作为一种广泛应用的无监督学习方法,K-means聚类算法以其高效表现在自动识别数据模式方面备受青睐,并广泛应用于数据分析领域[13]。文献[14]基于改进型K-means聚类算法进行数据分区,实现了数据分布的均匀化。文献[15]基于K-means无监督聚类学习法与熵权TOPSIS评价法建立评价模型。为获取较高的数据辨识效率,文献[16]提出了一种基于改进型K-means和深度神经网络算法的异常检测技术。然而,文献[14-16]方法在地面防空设备部署中仍面临两大关键挑战。一方面,这些部署方法在快速变化的战场环境中面临部署方案生成速度滞后的问题;另一方面,这些部署方法未充分利用战场环境的先验信息,使得部署方案在资源分配、覆盖范围和防护效能等方面欠缺合理性。
受ABC算法的时效性和K-means聚类算法无监督属性的启发,文中研究基于K-means聚类和ABC算法的地面防空设备部署方法。首先,将需要进行部署任务区域的数字高程模型(digital elevation model,DEM)数据用K-means算法进行聚类处理,形成不同部署适宜程度的部署位置集合;其次,基于聚类后的部署位置集合,利用人工蜂群算法进行部署策略的初始化过程;随后,对初始化产生的部署方案进行雇佣蜂和跟随蜂阶段的优化处理;最后,在侦察蜂阶段设置专家反馈机制,对迭代产生的部署方案进行校验处理。研究旨在利用K-means算法进行DEM数据聚类以形成先验信息,并在此基础上利用ABC算法优化地面防空设备的部署位置,从而改善部署方案的实时性与合理性。主要贡献如下。
1)将K-means算法与ABC算法结合,应用于地面防空设备部署,提高部署方案防空效能并且加快算法执行速度。为加快ABC算法迭代求解,利用K-means算法对部署区域进行预处理。这里,基于地形适应性进行聚类,减少搜索空间,从而加速算法收敛并提升解决方案的防空效能。
2)结合DEM数据,形成了一种地形敏感的优化策略。针对地面防空设备部署在复杂多变的战场环境中的挑战,基于地形特征对防空设备部署的影响,通过地形分析聚类,优化防空设备的部署位置,使得部署方案更能适应地形变化,增强了部署方案的合理性。
3)将专家反馈机制引入到ABC算法的侦察蜂阶段,进一步增强了部署方案的实时性与合理性。针对优化算法部署策略可能忽略特定因素的问题,结合诸如日常演习中搜集到的部署信息,将专家反馈机制引入到侦察蜂阶段中,提前终止不合理部署方案的迭代处理,优化了部署方案的实时性和合理性。
1 研究场景描述
在执行大规模地面防空设备部署任务时,由于防空设备类型多样,防空设备数目众多,加之可供部署的地面位置数量庞大,这一系列因素给大规模部署任务带来了巨大的挑战。防空设备部署方案的防空效能与多个因素密切相关,包括来袭方向上的火力纵深、宽度,以及部署方案中防空设备的火力密度和杀伤概率等[17]。为此,以地空导弹为示例,首先对来袭目标进行描述,随后,阐述地空导弹的性能指标。
1.1 来袭目标
g(t)=λe-λt
其中,λ是连续来袭目标之间的平均时间间隔的倒数,称为目标流强度。来袭目标流时间间隔T表示为[19]:
T=- ln r
其中,r是服从(0,1)均匀分布的随机数。
在保卫目标周边区域,每个地空导弹在其覆盖范围内会优先对先抵达的来袭目标进行射击。考虑射击时间服从指数分布的随机值,即[20]:
f(t)=μe-μt,t>0
F(t)=P(Tf<t)=1-e-μt,t>0
其中,μ表示在单位时间内平均来袭目标数。
在地空导弹对来袭目标进行射击任务时,以地空导弹为原点建立坐标系。假设来袭目标坐标为(x,y,z),地空导弹的导弹速度为v1,来袭目标的速度为v2,若考虑射击准备时间与转火时间tp,则从导弹发射到与来袭目标遭遇的射击周期Δt可表示为[19]:
Δt= +tp
1.2 地空导弹性能指标
地空导弹防空设备性能指标主要包括火力覆盖范围、火力交叉系数等。通过对来袭目标的特征进行分析,以更准确地评估部署方案的针对性和有效性。
1.2.1 火力覆盖面积与交叉系数
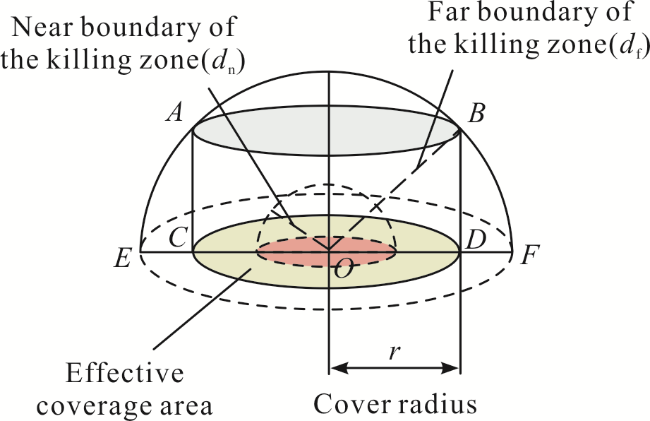
如图1所示,掩护半径为r的地空导弹有效掩护面积在地面投影为圆环状(绿色部分)。
根据文献[22],地空导弹火力覆盖区面积可表示为:
S=π(- )
其中:S表示火力覆盖区面积;df表示杀伤区远界斜距;dn表示杀伤区近界斜距。
在给定地空导弹目标通道数和单目标通道射击周期的情况下,区域火力交叉情况可反映火力密度。因此,火力交叉系数γ可表示为[22]:
γ=
其中:dA'B'为任意两位置A',B'之间的距离;df,A'和df,B'分别为位于任意两位置A',B'的地空导弹火力覆盖区远界。
1.2.2 掩护能力与部署方案效能
假定每发地空导弹杀伤概率为p,且相互独立。则在上述条件下,单个地空导弹在一个射击周期Δt内的掩护能力表示为[23]:
$P=\left\{\begin{array}{l}1-(1-p)^{\zeta}, d_{\mathrm{n}}<d<d_{\mathrm{f}} \\0, \text { 其他 }\end{array}\right.$
其中,ζ表示有效交战的目标数量,即:
ζ=min(μ,λΔt)
在文中所研究场景中,地空导弹防空效能综合考虑了火力覆盖面积S、火力交叉系数γ,以及地空导弹对保卫目标的掩护能力P。在多样化的战术背景下,通过调整各个因素的权重系数,达到优化部署方案的目的。假设现有m个地空导弹,n个保卫目标,则对火力覆盖面积、火力交叉系数和地空导弹对保卫目标的掩护能力归一化加权处理后,地空导弹部署方案的防空效能可表示为:
其中:ω1,ω2,ω3分别代表火力覆盖面积、火力交叉系数、掩护能力的加权系数,满足ω1+ω2+ω3=1;Si,j表示地空导弹i在保卫目标j处的火力覆盖面积;γi,j表示地空导弹i在保卫目标j处的火力交叉系数;Pi,j表示地空导弹i在保卫目标j处的掩护能力。
2 基于K-means ABC算法的地面防空设备部署方法
首先,给出部署区域的DEM数据进行预处理过程,然后展示ABC算法优化处理的详细过程。
2.1 DEM数据预处理
为提高算法优化效率,降低计算复杂度,根据部署区域的DEM数据,利用K-means算法进行预处理,通过排除某些地形因素对防空设备产生不利影响的部署位置,从而减小寻找优化部署方案的搜索空间,达到提高算法时效性以及合理性的目的。为此,根据部署区域DEM数据中的信息计算地形因子,然后,对得到的地形因子进行特征聚类,以便于后续ABC算法的优化处理。
2.1.1 地形因子计算
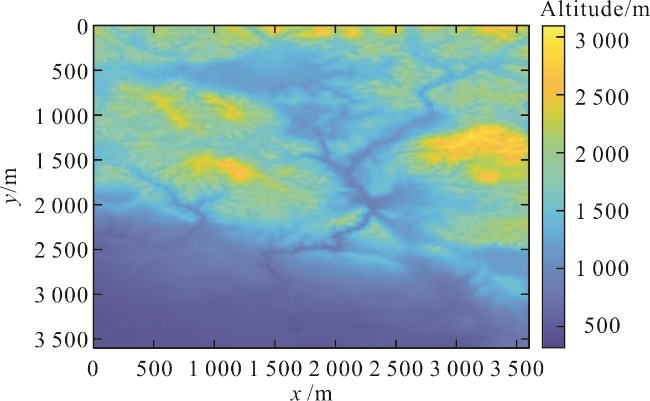
数字地形分析作为地形地貌研究的重要手段之一,其主要内容包括坡度分析、坡向分析等分析处理方法。DEM数据中可直接读取到的基本信息数据为海拔高程数据,即地面上任一点距大地水准面的垂直距离[24]。其每个栅格单元都包含了一个特定位置的海拔高程值Al,这些值构成了数字地形模型的基础信息,为地形分析等工作提供重要的数据支持。
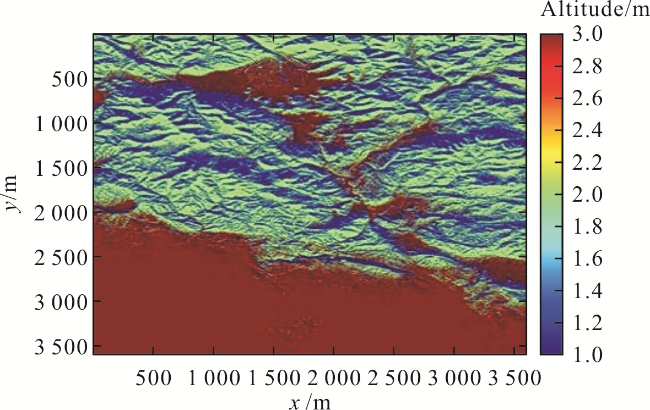
此外,坡度和坡向作为描述地理特征的重要指标,不但是许多地形分析模型(如水文模型、土地利用规划模型)的基础数据[25],而且能够间接反应某区域地形的起伏形态和结构特征。
Sl=tan
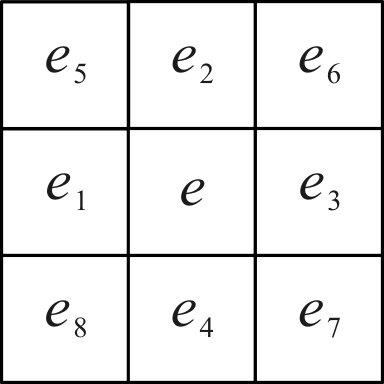
其中:sew为东西方向(即坐标轴上为X轴)上的坡度;ssn为南北方向(即坐标轴上为Y轴)上的坡度。
sew和ssn可表示为[24]:
sew=(e8+2e1+e5)-(e7+2e3+e6)/8c
ssn=(e7+2e4+e8)-(e6+2e2+e5)/8c
其中,c为DEM网格的间隔长度,若中心为No Data数据,则此栅格的坡度值也是No Data数据;如果相邻的任何栅格是No Data数据,则它们被赋予中心栅格的值再计算坡度。
在进行地形特征分析时,地面上任意一点的坡向表征了其高程值的最大变化方向[26],其计算公式为:
As=
其中As表示每个栅格与它相邻的栅格之间沿坡面向下最陡的方向。
2.1.2 特征聚类
为有效地进行地形特征的分析和聚类,需要对原始数据进行特征合成和数据标准化处理。
在获取部署区域每个位置的海拔、坡度和坡向这3个关键参数之后,将其整合成一个特征向量V,以此来表征地形的空间属性。假设部署区域中共有N个位置,其中第i个位置的特征向量Vi表示为:
Vi=[Al,i,Sl,i,As,i]T=[vi1,vi2,vi3]T,i=1,2,…,N
其中:Al,i为第i个位置的海拔高程;Sl,i为第i个位置的坡度;As,i为第i个位置的坡向。
为消除不同特征之间的量纲差异,使其在模型中权重更加平衡,对特征向量进行数据标准化。对于第i个位置的第j个特征vij,将原始特征vij处理为标准化特征 ,其表达式为:
=
其中:μj为N个位置的特征j的平均值;σj为N个位置的特征j的标准差。μj,σj可表示为:
2.2 基于ABC算法的优化处理
基于K-means聚类算法,DEM数据的预处理在一定程度上减小了防空设备部署方案寻优空间。然而,为使得问题求解更加聚焦和高效,文中采用ABC算法进一步优化处理,以提高方案防空效能并加快算法迭代过程。为此,给出ABC算法对部署方案的优化处理过程并对专家校验反馈机制进行了详细阐述。
2.2.1 ABC算法的优化处理阶段
基于K-means聚类结果,初始化阶段随机生成防空设备的初始部署方案。初始部署方案中的部署点位是从2.1节中确定的“优选部署点位”和“次优部署点位”集合中随机选取的。考虑在DEM数据中,由于二维坐标已经足够表示一个地理位置,因此不需要再引入z坐标(即高程信息),所以,初始化选取的第i个部署方案的坐标集合Si表示为:
Si={(xi1,yi1),(xi2,yi2),…,(xin,yin)}
其中,(xij,yij)表示第i个部署方案的第j个地空导弹需部署的位置坐标。初始部署方案中的横纵坐标均随机生成:
其中:xmin,xmax,ymin,ymax分别表示部署区域横纵坐标的最小值和最大值;α和β均为[0,1]之间的随机数。
此阶段产生的方案旨在为后续优化过程提供基础。通过在“优选部署点位”和“次优部署点位”中随机选择位置,能够在初始阶段就涵盖多种可能性,为算法提供足够的搜索空间,有助于更好地探索防空设备的部署位置。该方法增加了算法探索解空间的多样性,从而提高了发现全局最优解的概率,并有助于克服可能存在的局部最优解的挑战。
随后,通过雇佣蜂和跟随蜂阶段的邻域优化过程,算法对初始化阶段的部署方案进行迭代搜索和优化。第i个部署方案的第j个地空导弹部署位置优化过程表示为:
其中: ij和 ij分别表示第i个部署方案更新后的第j个地空导弹部署位置;φij和ηij均为[0,1]之间的随机数,分别表示第i个部署方案的第j个地空导弹部署位置更新系数。
在雇佣蜂阶段,通过评估每个部署方案的防空效能,并在其邻域内搜索更优解;在跟随蜂阶段,根据防空效能选择跟随的雇佣蜂,并在最优解邻域内进一步搜索。在N个部署方案中,跟随蜂阶段的选择概率Pfol表示为:
2.2.2 专家校验反馈机制
在经过ABC算法的初始化阶段以及雇佣蜂和跟随蜂阶段的邻域优化过程后,经典ABC算法会进入侦察蜂阶段,旨在避免算法陷入局部最优解。具体而言,当某个雇佣蜂在连续多次迭代中未能发现更优解时,该雇佣蜂会转变为侦察蜂。侦察蜂会放弃当前邻域的搜索,随机选择一个全新的点位作为新的搜索起点,从而引入新的搜索方向。由此,侦察蜂帮助算法跳出局部最优,继续探索更广泛的解空间,增加了发现全局最优解的可能性。
虽然侦察蜂阶段在一定程度上有助于发现更优解,但同时也会增加算法的复杂性和运行时间。在地面防空设备部署问题中,考虑到信息化、智能化的现代防空作战对部署方案的时效性的严格要求,通常更关注于能否快速产生一个满足给定指标要求的部署方案,而非追求最优解。因此,考虑利用专家校验反馈机制对经典ABC算法的侦察蜂阶段进行替换。
根据专家知识(日常演习中搜集到的部署信息),综合部署方案中防空设备的防空覆盖率、地形适应性等对产生的部署方案进行校验评分,第i个部署方案的评估值υi表示为:
υi=f(Si)
其中,f(·)是专家校验评估函数,综合考虑部署方案中防空设备的各种性能因素对产生的部署方案进行校验评分。
若产生了满足校验的部署方案,那么直接输出此方案;若产生的部署方案均不满足校验,那么根据专家知识对最接近校验规则的部署方案进行相应调整,直到满足校验条件后,输出此部署方案。
3 仿真结果
3.1 仿真参数设置与描述
假定现有某区域需进行防空部署任务,给定其仿真条件如表1所示[2,21,29]。根据文献[21],地空导弹杀伤区远斜距df取值范围设置为50~100 km,地空导弹杀伤区近斜距dn的取值范围设置为1~10 km。保卫目标数n设置为5,地空导弹装备个数m设置为50。根据文献[2],单发导弹杀伤概率p的取值范围设置为60%~90%,来袭目标流强度λ取值设置为5 min-1,来袭目标流时间间隔T的取10 min,单位时间内服务的平均来袭目标数μ的取值设置为1,即每分钟每个地空导弹平均服务1个来袭目标。根据文献[29],地空导弹的速度v1取500 m/s,来袭目标速度v2取300 m/s。火力覆盖面积加权系数ω1火力交叉系数加权系数ω2和掩护能力加权系数ω3均设置为1/3,即ω1=ω2=ω3=1/3。
表1 仿真参数Table 1 Simulation parameters |
| Parameter | Symbol | Value |
|---|---|---|
| Number of defense objective | n | 5 |
| Number of surface-to-air missile equipment | m | 50 |
| Far boundary of the killing zone for surface-to-air missiles/km | df | 50~100 |
| Near boundary of the killing zone for surface-to-air missiles/km | dn | 1~10 |
| Single shot probability of kill/% | p | 60~90 |
| Missile speed/(m/s) | v1 | 500 |
| Incoming target intensity/min-1 | λ | 5 |
| Inter-arrival time of incoming targets/min | T | 5 |
| Average number of incoming targets served per unit time | μ | 1 |
| Incoming target speed/(m/s) | v2 | 300 |
| Weighted coefficient of fire coverage area | ω1 | 1/3 |
| Weighted coefficient of firepower intersection factor | ω2 | 1/3 |
| Weighted coefficient of covering capability | ω3 | 1/3 |
为验证提出方法的有效性和鲁棒性,与经典群智能优化算法进行了防空效能对比。这些经典群智能优化算法包括:ABC算法、遗传算法、蚁群算法、灰狼算法和粒子群优化算法。具体的性能对比分析在3.2节和3.3节中给出。为定量地验证文中方法的有效性和鲁棒性,在相同的仿真条件下,文中方法与ABC算法、遗传算法、蚁群算法、灰狼算法和粒子群优化算法的迭代次数均选取为1 000。
3.2 有效性分析
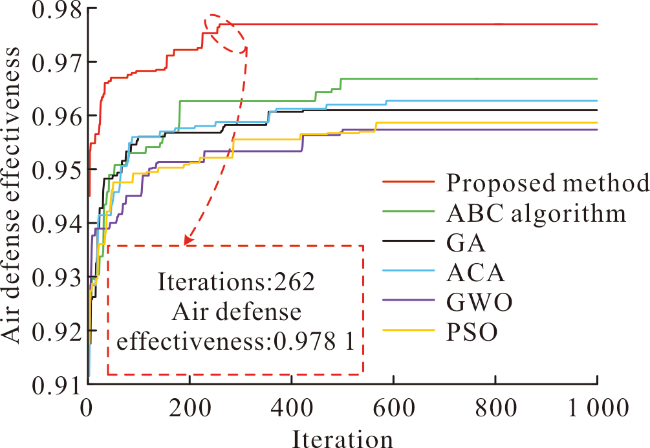
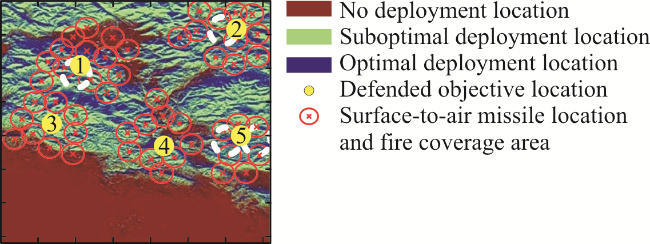
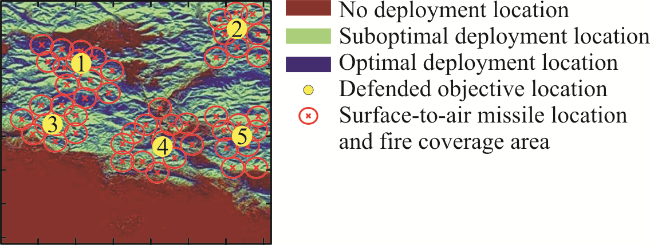
由图5可以看出:
1)相比于经典群智能优化算法,文中方法在初次迭代阶段就能产生高防空效能的部署方案,具体来说,文中方法在初次迭代得到的部署方案防空效能为0.945,而经典群智能优化算法在初次迭代阶段得到的部署方案防空效能均在0.94以下,这表明文中方法在对部署区域进行预处理后,能够得到更高质量的初始解,从而加快后续的算法迭代过程,提高算法的实时性;
2)相比于经典群智能优化算法,文中方法在经历迭代后,能更快地产生更高防空效能的部署方案,具体来说,文中方法在经历262次迭代后就产生了防空效能为0.978 1的部署方案,相比之下,经典群智能优化算法至少需要采用421次迭代后才能达到收敛,且产生的部署方案的防空效能均低于0.97,这表明文中方法具有更快的收敛速度和更优的防空效能,继而有效地改善了部署方案的实时性。
在与经典群智能优化算法相比较的过程中,文中方法在部署方案性能以及生成速度上体现出了优势。其原因在于K-means算法通过提前对部署区域的地形特征进行预处理,根据不同的地形特征对部署区域的部署点位进行分类,一定程度上优化了解空间,从而有利于部署方案的实时性改善,也有利于部署方案防空效能的提升。
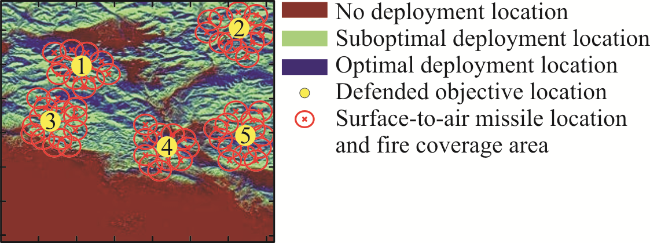
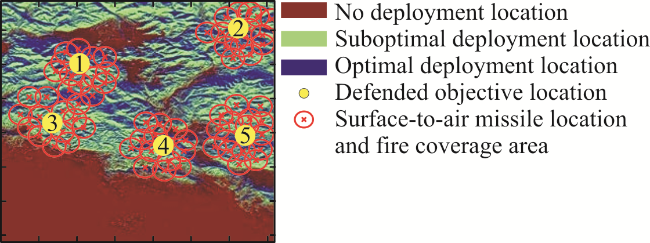
1)文中方法的火力覆盖更为全面,减少了部署盲区(或来袭缺口),从而增强了部署方案的合理性。通过K-means算法进行预处理改进,将防空区域细分为多个类别,“禁止部署点位”明确标识了不适合部署防空设备的区域,避免了不合理的部署点被纳入算法迭代过程中;这也在一定程度上减小了计算资源浪费。
需要说明的是,图6仅仅以经典的ABC方法为示例阐述部署效果,其他的经典群智能优化算法,如遗传算法、蚁群算法、灰狼算法和粒子群优化算法等,也有类似的结论,这里不再赘述。
3.3 鲁棒性分析
3.3.1 不同DEM数据的影响
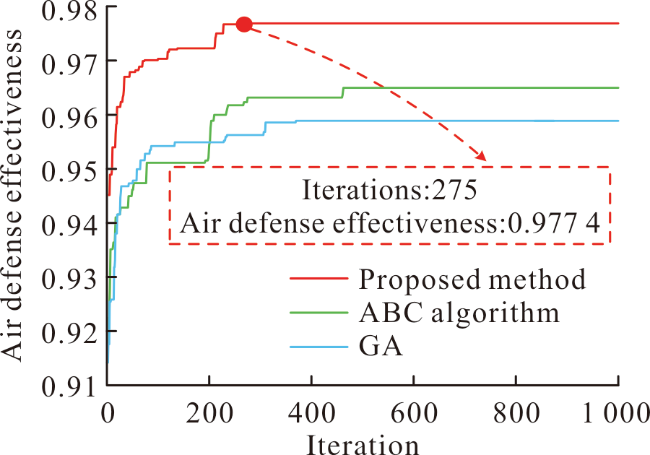
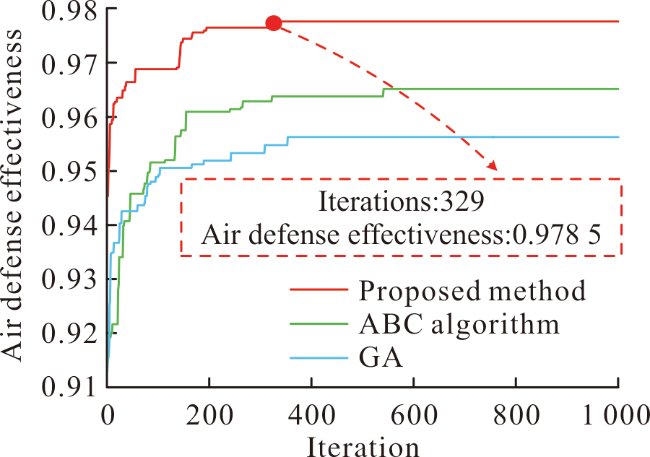
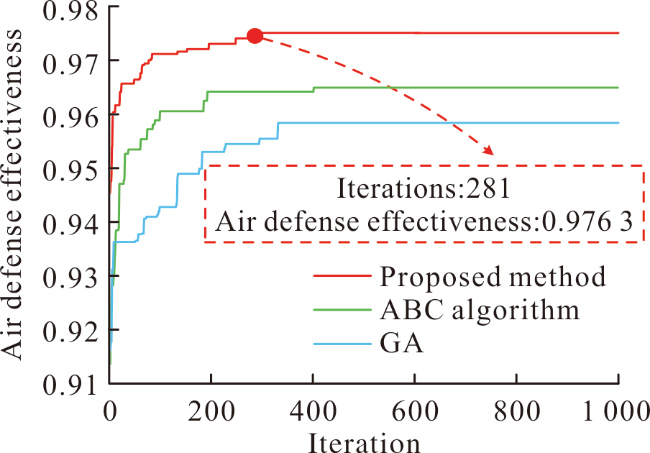
针对不同的区域,部署方案的防空效能差异不明显。在迭代收敛后,文中方法在不同区域产生的部署方案防空效能分别为0.977 4、0.978 5、0.976 3;ABC算法在不同区域产生的部署方案防空效能分别为0.964 8、0.965 2、0.964 5;遗传算法在不同区域产生的部署方案防空效能分别为0.958 9、0.955 7、0.958 7。区域的不同,对防空效能的影响并不明显。尽管如此,无论使用哪种DEM数据进行分析与模拟,文中方法的防空部署方案的防空效能均在0.975 0左右。相比之下,ABC算法和遗传算法产生的防空效能均低于0.970 0。这说明,即使是部署区域发生改变,相对于ABC算法和遗传算法,提出方法仍获得了更好的防空效能。因此,防空效能更取决于文中优化算法的精确性,而非单纯依赖于地形的物理特征。
针对不同的区域,部署方案收敛所需的迭代次数稍显不同。文中方法在不同的区域迭代收敛需要的次数分别为275、329、281;ABC算法在不同的区域迭代收敛需要的次数分别为453、562、401;遗传算法在不同的区域迭代收敛需要的次数分别为385、359、328。相比之下,随着区域的变化,ABC算法所需的迭代次数差异更大。尽管如此,对于各种给定地形,文中方法达到迭代收敛时所需的迭代次数明显少于ABC算法和遗传算法。因此,即使是部署区域发生改变,提出方法达到迭代收敛时所需的迭代次数仍少于ABC算法和遗传算法。文中方法在不同的区域中,均改善了部署方案的实时性。
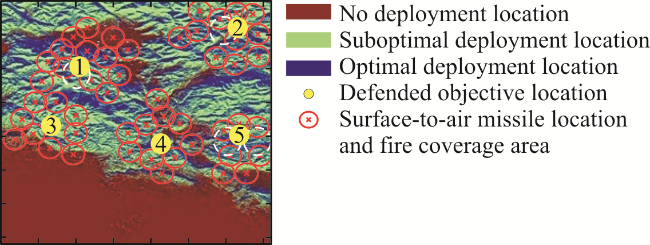
图11 ABC算法在区域1的部署方案示意图Fig.11 Schematic diagram of the deployment of the ABC algorithm in region 1 |
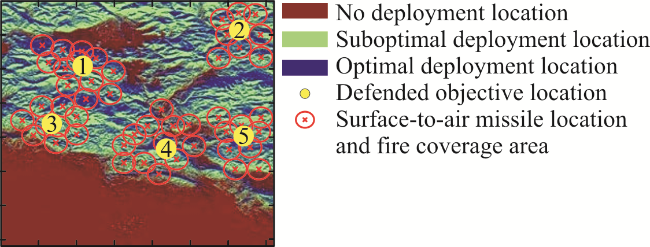
图12 文中方法在区域1的部署方案示意图Fig.12 Schematic diagram of the deployment of the research methodology in region 1 |
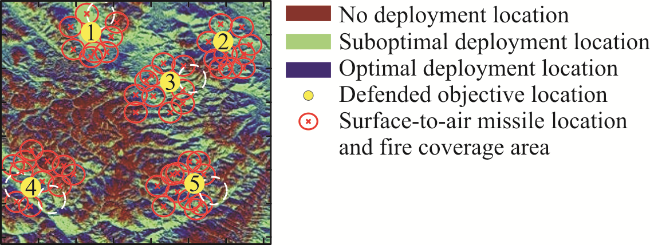
图13 ABC算法在区域2的部署方案示意图Fig.13 Schematic diagram of the deployment of the ABC algorithm in region 2 |
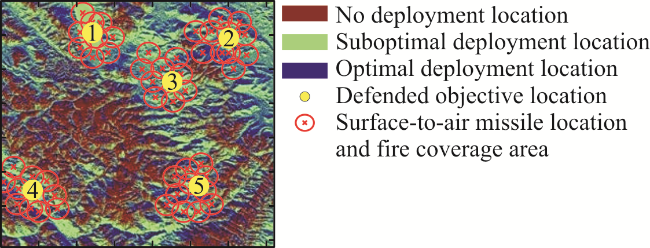
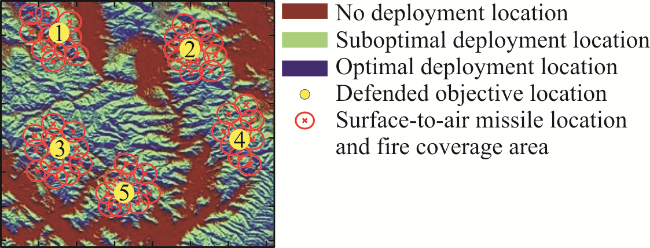
图14 文中方法在区域2的部署方案示意图Fig.14 Schematic diagram of the deployment of the research methodology in region 2 |
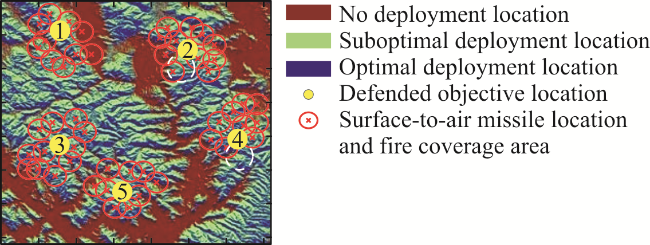
图15 ABC算法在区域3的部署方案示意图Fig.15 Schematic diagram of the deployment of the ABC algorithm in region 3 |
3.3.2 不同地空导弹数的影响
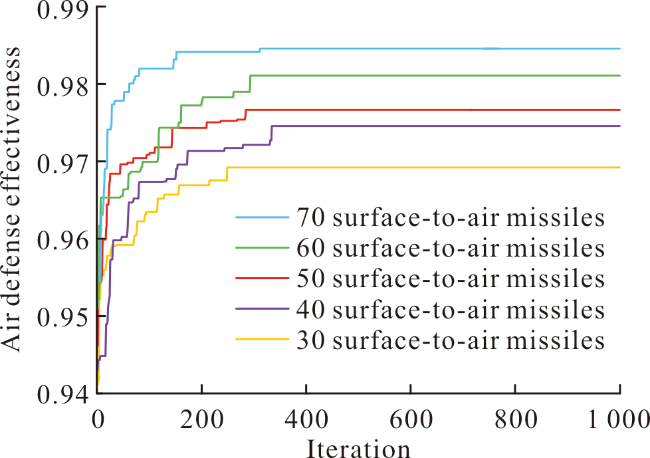
图17 不同数量地空导弹的防空效能比较Fig.17 Comparison of the air defense effectiveness of different quantities of surface-to-air missiles |
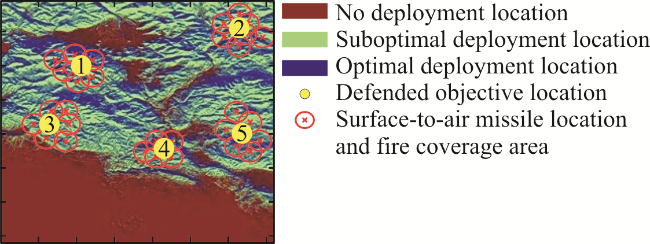
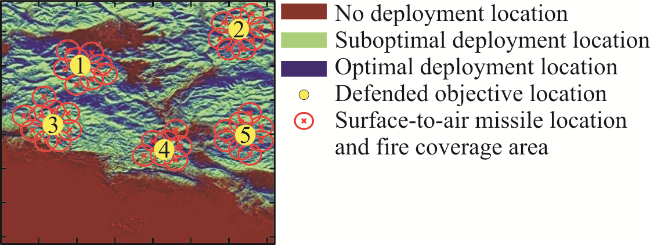
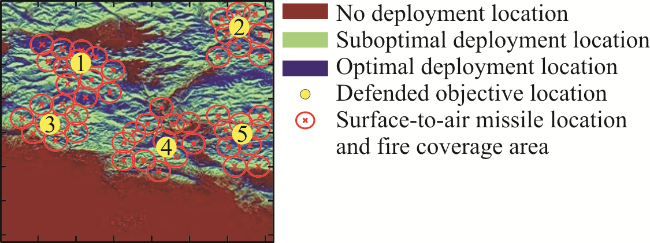


从图17可以看出,随着地空导弹数量的增强,产生的部署方案防空效能逐渐增加。具体来说,地空导弹数为30的部署方案初代防空效能仅在0.941 3,而地空导弹数为70的部署方案初代防空效能可达0.954 2,不同数目的地空导弹组成的部署方案。此外,在经历若干次迭代后,随着地空导弹数目的增加,防空效能也有了显著增加。具体的,地空导弹数为30时的部署方案在经历243次迭代后产生的部署方案防空效能为0.968 6。地空导弹数为70时的部署方案在经历317次迭代后产生的部署方案防空效能为0.984 9,这体现了地空导弹数量优势对防空效能的直接提升作用。
针对不同数目的地空导弹数量,部署方案收敛所需的迭代次数变化不明显。导弹数为30、40、50、60、70时经文中算法迭代产生的部署方案,其迭代次数分别为233、326、287、294、308。地空导弹数目的不同,对部署方案收敛所需的迭代次数的影响并不明显,说明文中方法在应对不同部署场景时具有良好的适应性和优化能力。
4 结论
文中利用K-means算法对部署区域的DEM数据进行预处理,根据不同地区的坡度、坡向等地形特征,将部署区域中的位置分为不同类别,对部署点位预先进行筛选处理。然后再通过ABC算法对筛选后的部署方案进行迭代搜索,并且通过日常演习中搜集到的部署信息进行部署方案的校验,确保算法快速产生的部署方案能满足高防空效能的同时,利用战前收集的先验信息增强部署方案的合理性。仿真实验表明,研究方法产生的部署方案防空效能达到了0.978 1,而且迭代次数为262就能够收敛。而经典群智能优化算法产生的部署方案的防空效能均在0.960 0附近,而且迭代次数超过400才能实现收敛。通过与经典群智能优化算法的仿真对比,验证了研究方法的实时性与合理性。文中研究为防空部署领域提供了一种新方法,有效地提升了部署方案生成速度,增强了部署方案的合理性。