

0 引言
1)固有频率。为避免振动试验夹具与试验件两者的耦合效应导致过大的共振和反共振,应要求夹具一阶固有频率高于试验频率上限,若因结构较大无法满足时,应要求夹具在振动激励方向上的一阶固有频率至少高于试验件一阶固有频率1个倍频程。
2)质量。在满足强度和刚度要求的情况下,应尽可能减小振动试验夹具的质量,以避免消耗更多的振动台推力。
3)传递特性。为保证振动激励的均匀输入,要求振动夹具具有良好的振动传递特性,应严格按照振动夹具设计规范限制振动响应中的共振峰个数。
4)接口尺寸。振动试验夹具与试验件的接口尺寸应满足试验件实际工作时的安装状态,振动试验夹具与振动台的接口尺寸应满足振动台的台面尺寸以及安装螺孔分布情况。
针对结构优化,可按照设计变量类型分为拓扑优化、形状优化和尺寸优化3个层次,其分别对应产品设计中的概念设计、基本设计和详细设计3个阶段[3]。其中拓扑优化是在满足应力、位移等约束条件下,在特定的设计域内寻求使结构某种性态达到最优的材料分布方式[4]。近几十年来,结构拓扑优化理论和方法已有了长足的发展。Bendsoe和Kikuchi提出了均匀化法的结构拓扑优化概念[5]。Rozvany归纳总结了已应用于商业软件中的SMIP和ESO两种拓扑优化方法[6]。Sigmund和Maute对比了密度法、冒泡法、水平集法和相场法的优缺点和异同点[7]。形状优化和尺寸优化是在保持宏观结构不变的条件下,寻求结构的最佳边界和最佳界面尺寸,其研究重点在于优化算法[8-10]以及灵敏度分析[11-12]。
针对振动试验夹具的结构优化,单一地进行轻量化与静刚度优化已经无法满足其设计基本要求,基于动力学的结构优化设计是提高夹具固有频率和改善传递特性的重要手段[13-14]。王勇等设计了飞行器直线作动机构振动试验夹具,应用有限元仿真方法进行了模态分析和随机振动分析并通过随机振动试验验证了所涉及夹具的可用性[15]。李贵林开展适用于电子舱段的三轴振动专用夹具的结构设计与结构优化研究,基于多目标遗传算法(MOGA)对振动夹具进行尺寸优化设计,并对优化后的振动夹具进行了振动传递特性分析,确保振动夹具设计的合理性和可行性[16]。张允涛等采用拓扑优化的方法对轨姿控发动机振动试验夹具进行了结构设计改进,优化后振动夹具的模态频率和动态响应特性得到显著改善[17]。陈腾飞等综合使用拓扑优化和尺寸优化两种方法对夹具进行优化设计,优化后的夹具具有良好的动力学传递特性,验证了综合优化方法的有效性及可行性[18]。王轲等基于Patran/Nastran有限元仿真平台,交替采用拓扑优化和参数化优化对夹具进行设计与改进,得出满足要求的振动夹具设计方案,最后通过试验证明了设计的有效性[19]。
文中以舵机控制驱动器振动试验的典型夹具作为研究对象,采用NX和ANSYS Workbench协同仿真技术,首先基于变密度法的SIMP计算模型的拓扑优化方法对振动夹具结构外形进行优化设计,再基于多目标遗传算法对振动夹具接口尺寸进行优化设计,最后完成振动夹具的试制和可靠性试验验证,为弹箭武器装备弹上控制部件振动试验夹具的设计提供参考。
1 振动试验夹具设计流程
舵机控制驱动器振动试验夹具一般设计流程如图1所示。
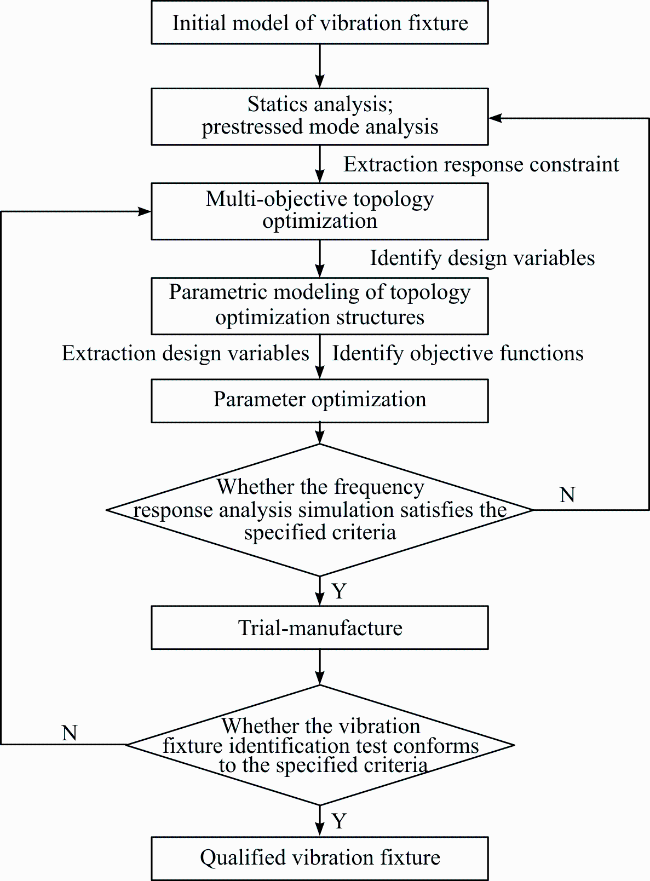
首先根据试验件的特性(形状尺寸、连接方式和尺寸、质量特性以及基本振动模态等)、振动台性能参数、振动试验条件等设计输入,以及工装夹具设计准则等进行振动试验夹具的初始形状、结构与功能设计;再基于Workbench对初始方案进行静力学分析与预应力模态分析,分别提取静应变能、第一阶固有频率与第四阶固有频率作为响应约束,设计优化区域、优化目标与制造约束,对初始模型进行基于固有频率的多目标拓扑优化;评估拓扑优化结果,基于NX对夹具进行拓扑优化结构的参数化建模,并确定设计变量;采用响应面法,基于多目标遗传算法(MOGA)对振动夹具进行参数化优化分析;判断频响分析结果是否满足设计要求;对满足设计要求的优化结构模型进行试制生产加工;最后通过振动夹具鉴定试验判断其是否合格。
2 振动试验夹具动力学结构优化设计方法
2.1 结构预应力模态分析方法
固有频率与固有振型分析是振动试验夹具动力学结构优化过程中的重要评价指标。对于N维自由度系统的强迫振动动力学方程,可表达为:
M +C +Ku=F(t)
式中:M为结构的总质量矩阵;C为结构的阻尼矩阵;K为结构的总体刚度矩阵;u为位移矢量; 为速度矢量; 为加速度矢量;F为强迫振动施加的外载荷。
结构的固有频率指自振频率,与外载荷无关,因此可令外载荷F=0,并且舵机驱动器振动夹具一般不涉及附加阻尼处理,因此在进行结构模态分析时,可将结构看做无阻尼线性自由振动系统,令C=0。则式(1)可改写为一个常系数齐次常微分方程组:
M +Ku=0
式(2)可等效为一个线性齐次代数方程组:
K-λMϕ=0
式中:ϕ是位移的振幅列向量,称为方程组的特征向量;λ为方程组的特征值。
若要使式(3)有非零解,则其系数矩阵的行列式必然为零,得到一个常系数齐次微分方程组的特征方程:
det(K-λM)=0
在有限元分析中,如果划分网格后,所有节点的位移分量的总数为n,则式(4)所表示的特征方程即为n次代数式,可解得n个特征值λi,ωi= 即为结构各阶固有频率;与结构各阶固有频率相对应,式(3)可以确定n个振幅列向量ϕi即为结构各阶固有频率相对应的固有振型。
在实际工程中,存在考虑摩擦接触、大变形等非线性因素的模态计算,而由于模态计算是线性的、不考虑外载荷的,为解决考虑外载荷(如预紧力、热应力等)的实际工况下的非线性影响,ANSYS Workbench采用线性摄动方法间接考虑其影响从而提高精度,其方法主要是将外载荷引起的变形等效为刚度的改变,从而影响模态。因此,结构的总体刚度矩阵K可改写为:
K= + + + +
式中: 为材料刚度矩阵; 为考虑摩擦接触贡献的刚度矩阵; 为考虑结构承受外部压力或随动载荷贡献的刚度矩阵; 为考虑旋转软化的刚度矩阵; 为考虑应力刚化的刚度矩阵; 与 为因大变形引入的刚度。
2.2 拓扑优化设计方法
拓扑优化是一种数学方法,能在给定的空间结构中生成优化的形状及材料分布。结构拓扑优化的基本思路是将寻求结构的最优拓扑问题转化为在给定的设计区域内寻求最优材料分布的问题[20]。采用变密度法的SIMP计算模型,每个单元的材料密度直接被用作设计变量,在[0,1]区间内连续变化,0和1分别代表空和实,中间值代表假想的材料密度值。
舵机驱动器振动试验夹具设计目标为某几阶固有频率分别大于某常数值,在动态拓扑优化过程中,由于结构的改变,固有频率呈动态变化,作为设计目标的某几阶固有频率并不能直接反映其他阶次的动态变化,故而引入平均频率公式[21]协调各阶固有频率,并将其作为优化目标从而提高整个结构优化结果的可行性。平均频率公式为:
式中:Λ为前n阶平均固有频率;λi为第i阶特征频率;ωi为第i阶固有频率的权重系数;n为固有频率阶次;λ0,s为调整目标函数的参数。
对于静力响应优化问题,刚度最大问题可转换为柔度最小化问题,即静应变能最小化问题,其计算公式为:
Cs=FTu=uTku
式中:Cs为结构静应变能;u为节点位移向量;k为节点刚度矩阵。
基于变密度法的SIMP计算模型,采用静力响应与动态振动固有频率综合的多目标拓扑优化方法,计算时使用折衷规划法[22]结合平均频率法的策略,因此拓扑优化问题可表达为:
式中:ρ=(ρ1,ρ2,…,ρn)T为结构单元拓扑优化设计向量;ρ0为单元初始密度;n为单元总数;F(ρ)为综合优化目标函数;ω为静应变目标函数的权重;k为工况数;ωj为第j个工况的权重系数;Cj(ρ)为第j个工况的静应变目标函数; 和 为第j个工况下静应变目标函数优化的上下限;Λ(ρ)为平均频率目标函数;Λmax和Λmin为平均频率目标函数优化的上下限;ρj为第j个单元的相对密度;Vj为第j个单元的体积;m0为结构原始总质量;a为质量保留百分比;ρmax和ρmin为单元相对密度优化的上下限。
2.3 参数优化设计方法
$\begin{array}{l}\text { find } \boldsymbol{X}=\left(x_{1}, x_{2}, \cdots, x_{n}\right)^{\mathrm{T}} \\\min f_{1}(\boldsymbol{X})=f_{1} \\\max f_{2}(\boldsymbol{X})=f_{2} \\\max f_{3}(\boldsymbol{X})=f_{3} \\\text { s.t. } \boldsymbol{X} \in \boldsymbol{\Omega} \\\qquad f_{2}(\boldsymbol{X}) \geqslant 1000 \\\quad f_{3}(\boldsymbol{X}) \geqslant 2000\end{array}$
式中:X=(x1,x2,…,xn)T为优化设计变量;f1为振动方向加速度最大值;f2为振动夹具第一阶固有频率;f3为振动夹具第四阶固有频率;Ω为优化设计变量的可行域。
3 舵机控制驱动器振动试验夹具设计
3.1 舵机控制驱动器振动试验夹具初始模型设计
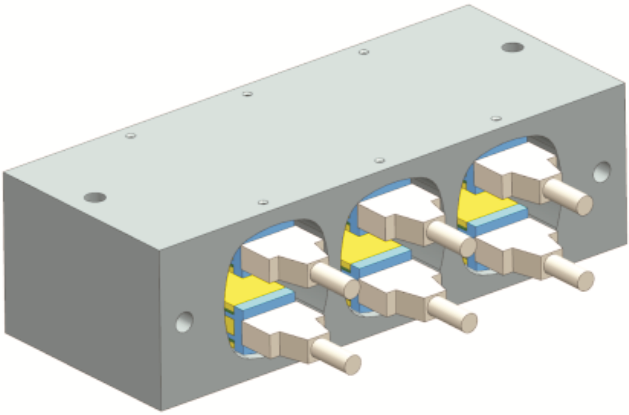
根据舵机控制驱动器的形状尺寸、接口尺寸、质量特性以及其在控制舱体中的实际安装条件以及振动台的接口尺寸等基本特性设计夹具的初始模型,其振动试验的初始夹具与试验件装配后的结构形状如图2所示,振动夹具一次可安装6件试验件,试验件与夹具通过螺钉连接,夹具与振动台通过夹具两端的通孔使用螺栓与振动台面连接。初始夹具具备结构简单、固有频率高、振动传递特性好等优点,但也存在质量较大、材料利用率偏低等问题,需采用拓扑优化去除多余材料。
3.2 初始振动夹具拓扑优化
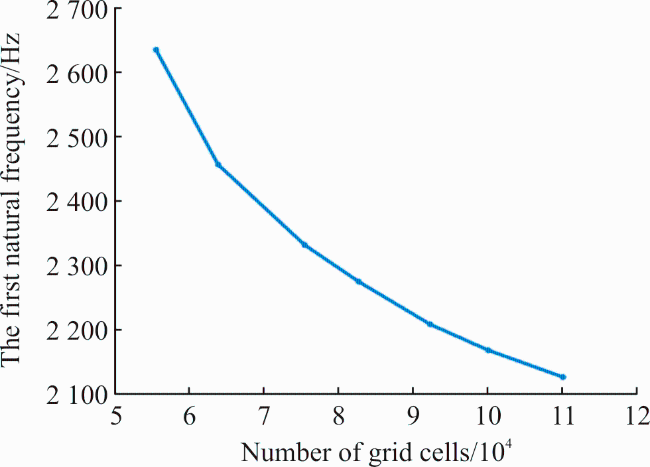
在建立振动试验夹具有限元模型时,考虑迭代计算的便利性,对其几何模型进行清理简化,删除12处沉头过孔,并将6件舵机控制驱动器的有限元模型分别简化为6处质量点,赋予其质量特性。振动夹具材料选用铝合金2A12-T4,初始模型采用基于多区域法(multizone)的六面体网格进行划分网格,随着网格总数的增加,振动夹具第一阶固有频率趋于平缓,当网格总数为110 040时,第一阶固有频率变化小于2%,因此满足计算精度要求,网格无关性分析如图3所示。
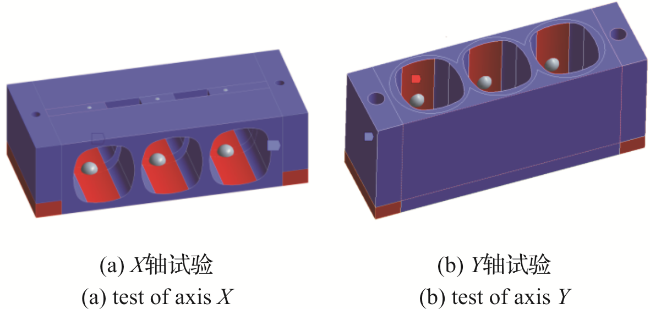
振动试验分为导弹发射方向(X轴)和垂直地面方向(Y轴)两个方向,通过旋转振动夹具的方式完成试验方向的转变,因此在拓扑优化时需分别考虑两个方向的试验工况创建模型。如图4所示,蓝色部分为拓扑优化设计区域,红色部分为拓扑优化非设计区域。
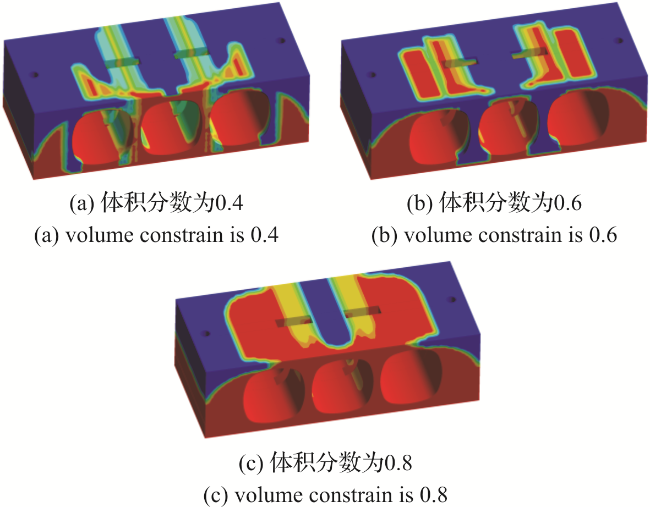
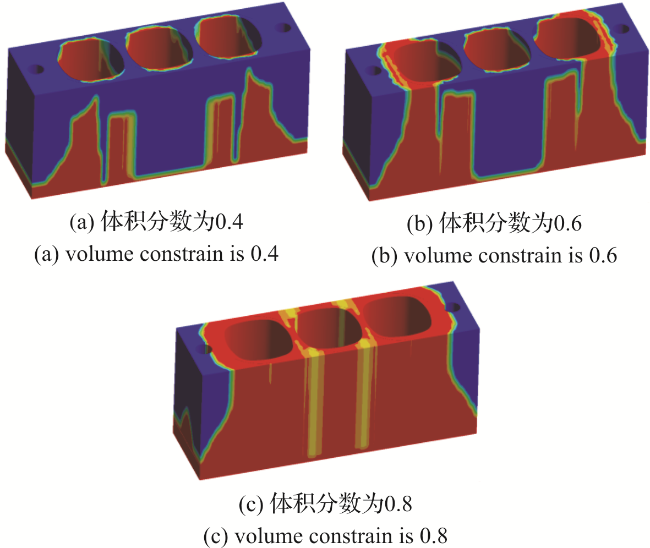
分别对初始夹具X轴向与Y轴向进行拓扑优化。优化目标为静应变能最小与前4阶平均固有频率最大,其中第一阶固有频率需大于1 000 Hz,第四阶固有频率需大于2 000 Hz。通过在振动夹具与试验件的接口单元施加与振动方向一致的单位力模拟其静态过载工况。相对于静刚度而言,振动夹具对动刚度的要求更高,结合工程实际对目标权重进行确定,静应变能与平均固有频率分别取0.3和0.7。动态频率拓扑优化的固有频率目标权重与前四阶固有频率的振型相关,X轴向前四阶固有频率权重分别取0.2、0.4、0.2和0.2,Y轴向前四阶固有频率权重分别取0.3、0.3、0.2和0.2。最小成员尺寸取5,沿振动方向法向面设置对称约束,底面法向方向设置为挤出制造约束,采用体积分数作为约束条件,分别取0.4、0.6和0.8,X轴与Y轴向优化结果分别如图7和图8所示。优化后结构呈中间高两侧低的“凸”字型,振动夹具与试验件接口区域材料去除量较少,两端螺栓连接用过孔处材料去除量较大。
3.3 模型重构及预应力模态分析
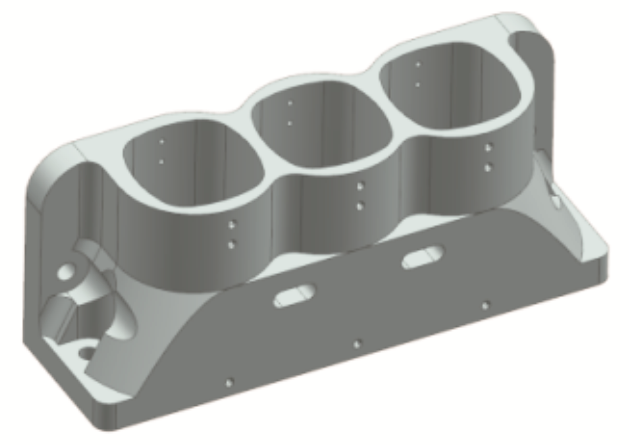
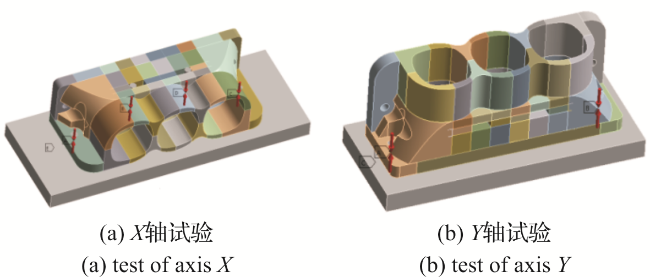
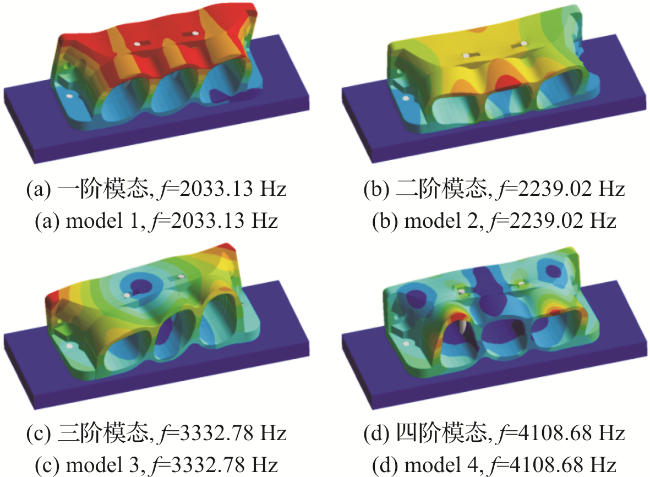
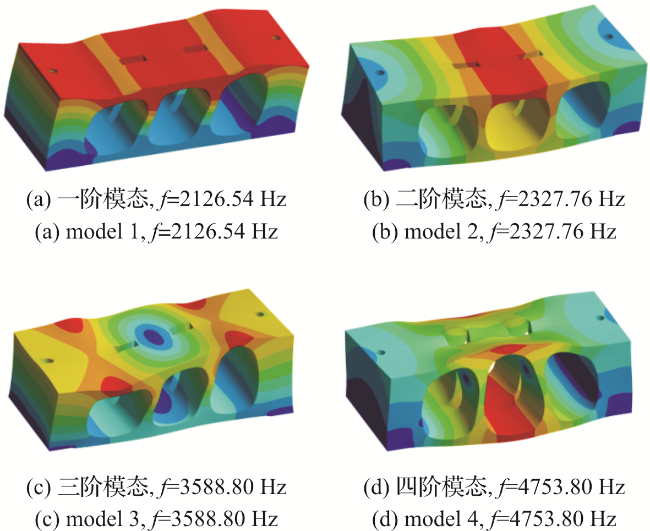
图11 优化后X轴向试验振动夹具的前4阶模态示意图Fig.11 Schematic diagram of the first 4 modes of the optimized vibration fixture for axis X test |
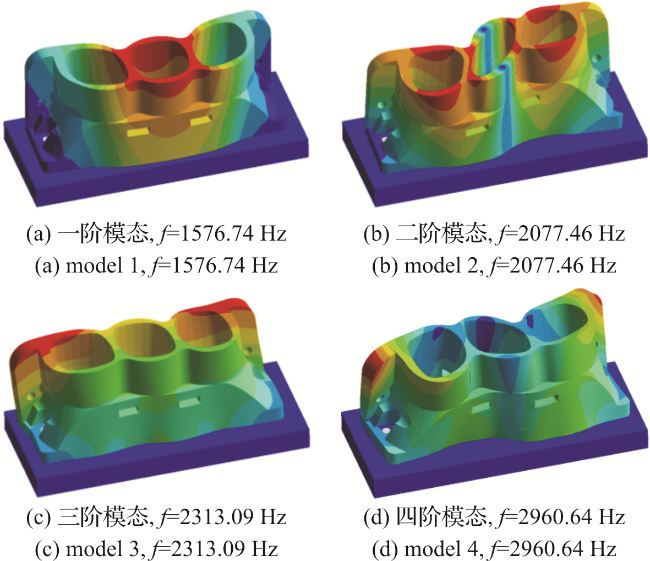
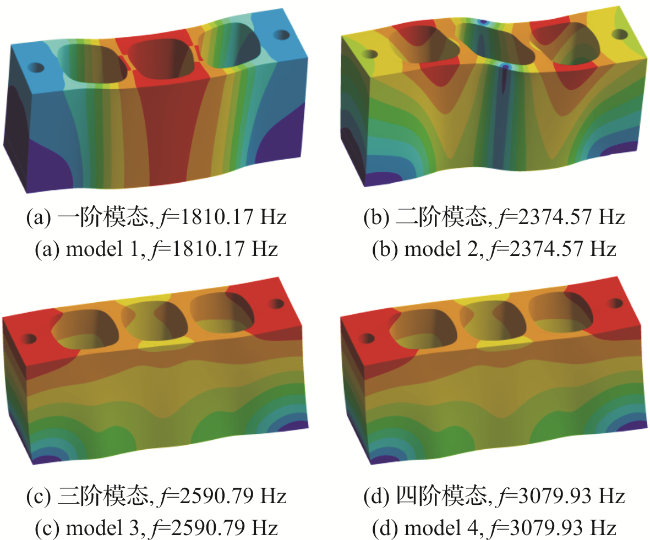
图12 优化后Y轴向试验振动夹具的前4阶模态示意图Fig.12 Schematic diagram of the first 4 modes of the optimized vibration fixture for axis Y test |
表1 振动夹具拓扑优化前、后主要参数对比Table 1 Comparison of main parameters of vibration fixture before and after topology optimization |
| Status | Mass/kg | The first natural frequency/Hz | The second natural frequency/Hz | The third natural frequency/Hz | The fourth natural frequency/Hz | Static strain energy/(kN·mm) | |||||
|---|---|---|---|---|---|---|---|---|---|---|---|
| Axis X | Axis Y | Axis X | Axis Y | Axis X | Axis Y | Axis X | Axis Y | Axis X | Axis Y | ||
| Before optimization | 6.89 | 2 126.54 | 1 810.17 | 2 327.76 | 2 374.57 | 3 588.80 | 2 590.79 | 4 753.80 | 3 079.93 | 2.23 | 7.32 |
| After optimization | 4.64 | 2 033.13 | 1 576.74 | 2 239.02 | 2 077.46 | 3 332.78 | 2 313.09 | 4 108.68 | 2 960.64 | 5.86 | 8.44 |
优化后的振动夹具质量对比优化前降低32.65%,减重效果明显,由于材料分布偏向Y轴方向底部呈“凸”字形,其可以保证Y轴方向的刚度,但X轴方向的刚度降低较为显著。通过有限元静力学分析,优化后的振动夹具的X轴静应变能提高了163%,Y轴静应变能提高了15%。
对比优化前和优化后振动夹具预应力模态分析的前四阶固有频率及其振型,优化后的振动夹具的前四阶固有频率均有所下降,X轴向一阶固有频率由2 126.54 Hz下降至2 033.13 Hz,振型表现为夹具顶面横向位移,主振方向位移较小,Y轴向一阶固有频率由1 810.17 Hz下降至1 576.74 Hz,振型表现为夹具主振方向位移,两种振动工况下从第二阶固有频率起均大于2 000 Hz,超过试验频率10~2 000 Hz。
3.4 随机振动仿真分析
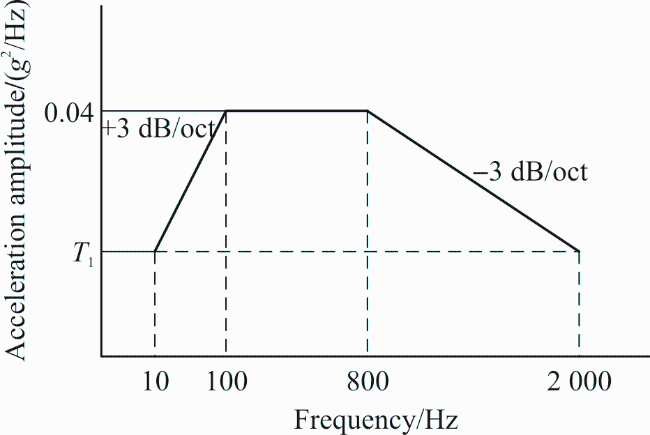
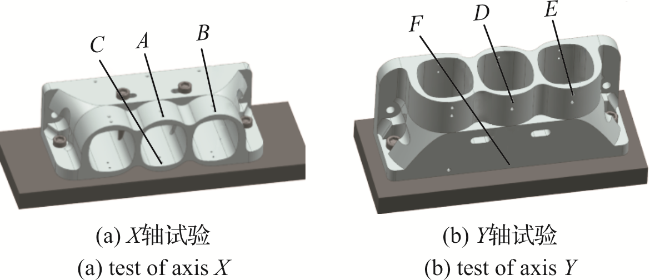
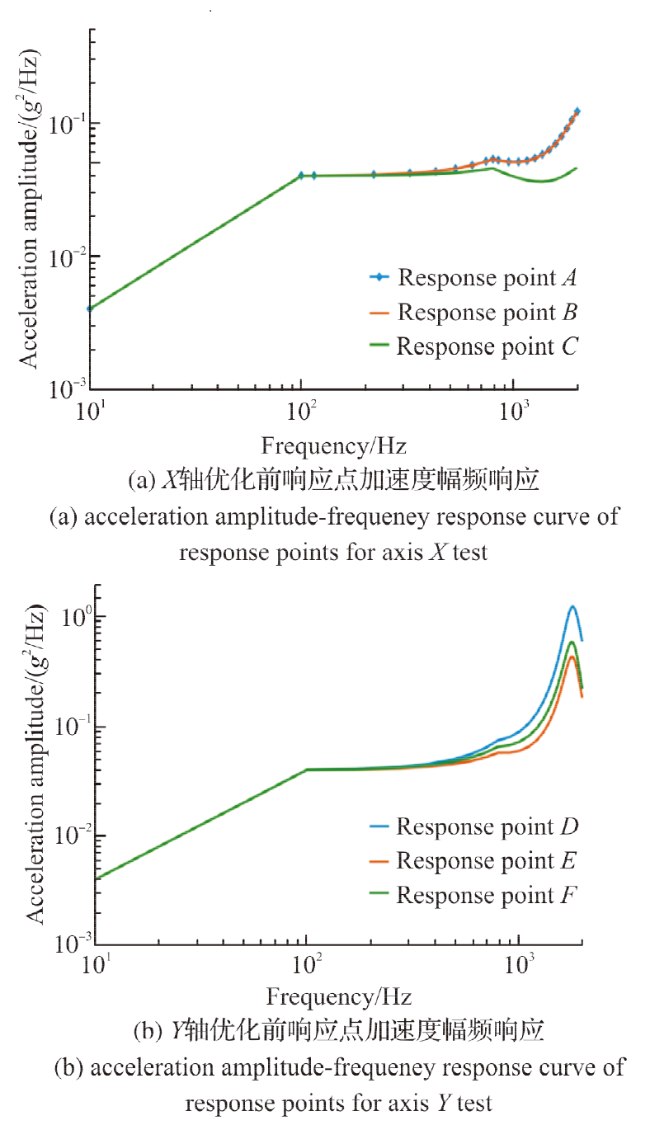
图15 优化前振动夹具响应点加速度幅频曲线Fig.15 Acceleration amplitude-frequency response curve of response points of fixture before optimization |
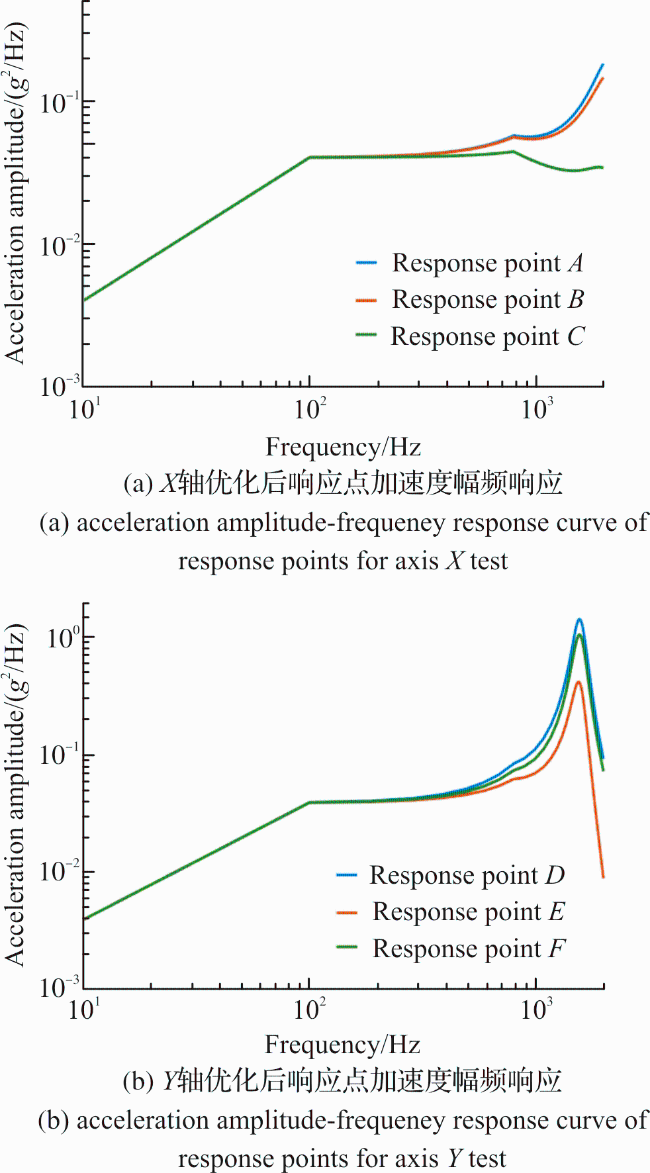
图16 优化后振动夹具响应点加速度幅频曲线Fig.16 Acceleration amplitude-frequency response curve of response points of optimized fixture |
表2 响应点加速度均方根值GRMS与品质因数QTable 2 GRMS value and quality factor of response points |
| Response point | Before optimization | After optimization | ||
|---|---|---|---|---|
| GRMS/g | Q | GRMS/g | Q | |
| A | 10.768 | 1.397 | 11.859 | 1.539 |
| B | 10.734 | 1.393 | 11.609 | 1.641 |
| C | 8.884 | 1.153 | 8.530 | 1.107 |
| D | 23.814 | 3.091 | 23.967 | 3.111 |
| E | 15.585 | 2.023 | 14.409 | 1.870 |
| F | 17.729 | 2.301 | 20.961 | 2.720 |
对比图15、图16与表2,X轴向优化前的响应点加速度幅值为响应点A处2 000 Hz时的0.122 g2/Hz,X轴向优化后的响应点加速度幅值为响应点A处2 000 Hz时的0.182 g2/Hz,优化前和优化后X轴向最大加速度响应均方根值分别为10.768 g与11.859 g,品质因数分别为1.397与1.539;Y轴向优化前的响应点加速度幅值为响应点D处1 792.2 Hz时的1.258 g2/Hz,Y轴优化后的响应点加速度幅值为响应点D处1 566.7 Hz时的1.497 g2/Hz,优化前和优化后Y轴向最大加速度响应均方根值分别为23.814 g与23.967 g,品质因数分别为3.091与3.111。优化后的振动夹具在X轴向与Y轴向的频响分析结果表明,在10~2 000 Hz以内凸频点均为1处,数量不变,最大加速度响应均方根值与品质因数也基本保持一致,且品质因数满足小于5。因此拓扑优化后,在振动夹具质量明显下降后,其振动传递性能没有下降并依旧满足设计要求。优化后的振动夹具在X轴与Y轴随机振动中,承受的最大应力分别为2.565 MPa与12.953 MPa,远小于铝合金的屈服强度280 MPa,因此优化后振动夹具的承载能力足够,满足设计强度要求。
3.5 参数优化设计
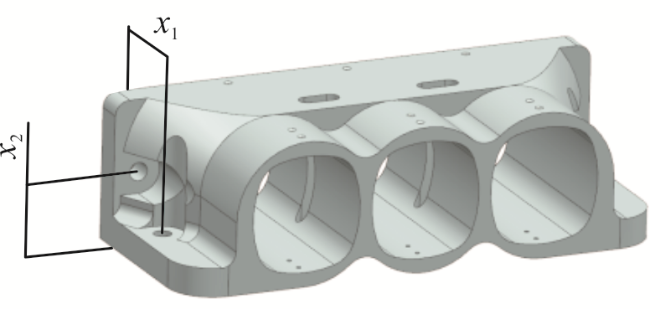
通过拓扑优化完成振动夹具的基本形状设计后,采用参数优化方法对振动夹具与振动台的接口位置进行设计。优化参数分别为X轴向试验时安装孔位置x1与Y轴向试验时安装孔位置x2,如图17所示。将第一阶固有频率最大值和随机振动方向加速度的最小值定义为多目标函数。根据实际设计空间,以mm为单位分别设定约束条件为:x1∈[35,60],x2∈[35,65]。
X轴、Y轴向试验时安装孔位置x1和x2与固有频率及随机振动方向加速度最大值的映射关系分别如图18和图19所示。由图可知,X轴向第一阶固有频率f1随x1的增加而增大,x1在44.18 mm时,f1达到最大2 037.78 Hz,随后固有频率随x1的增加而减小,振动方向加速度最大值Gmax1随x1的增大而减小,x1在43.23 mm时,Gmax1达到最小值12.003 g,随后振动方向加速度最大值随x1的增加而增加;Y轴向第一阶固有频率f2随x2的增加而增大,x2在47.28 mm时,f2达到最大1 580.16 Hz,随后固有频率随x2的增加而减小,振动方向加速度最大值Gmax2随x2的增大而减小,x2在42.41 mm时,Gmax2达到最小值24.85 g,随后振动方向加速度最大值随x2的增加而增加。
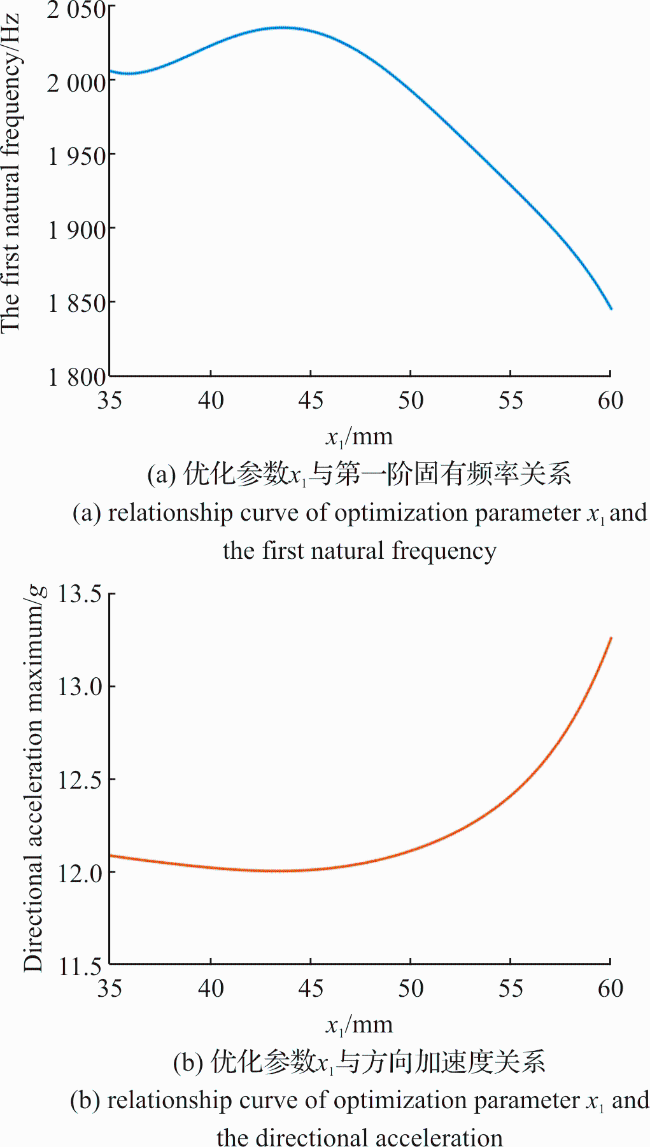
图18 优化参数x1与第一阶固有频率和方向加速度关系曲线Fig.18 Relationship curve of optimization parameter x1、the first natural frequency and directional acceleration |
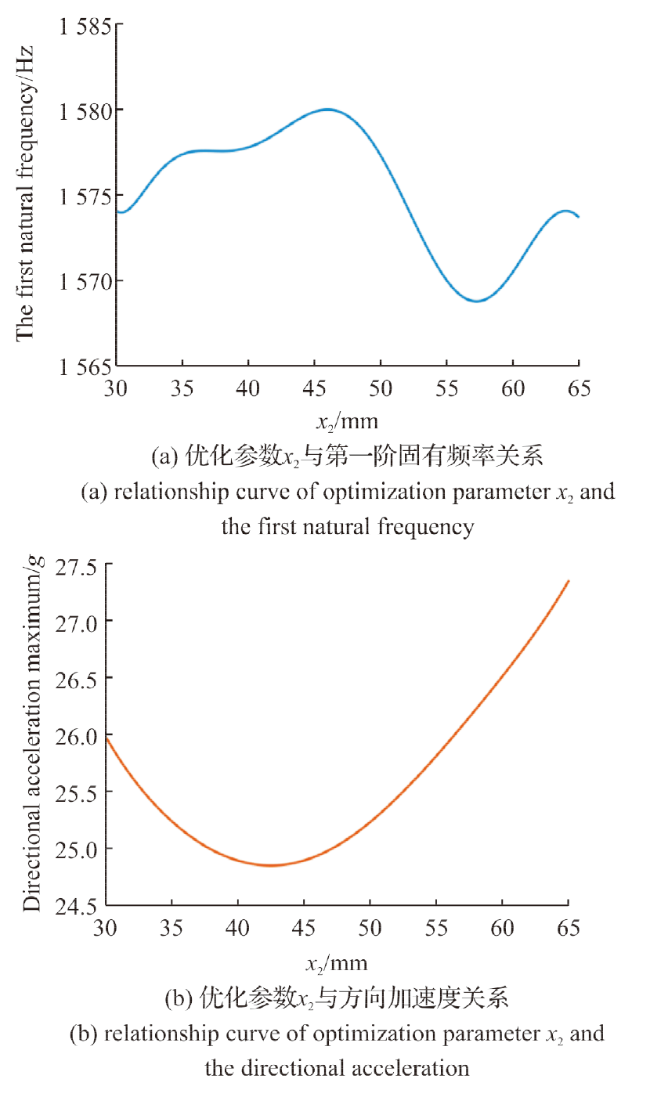
根据参数优化的候选点解,选取结构设计参数为:x1为44.494 mm,x2为43.734 mm,此时f1为2 036.26 Hz,f2为1 578.93 Hz,Gmax1为12.01 g,Gmax2为24.86 g,响应点A,B,C的加速度响应均方根值分别为11.768 g、11.466 g、8.341 g,响应点D,E,F的加速度响应均方根值分别为23.802 g、14.028 g、20.554 g。
4 试验验证
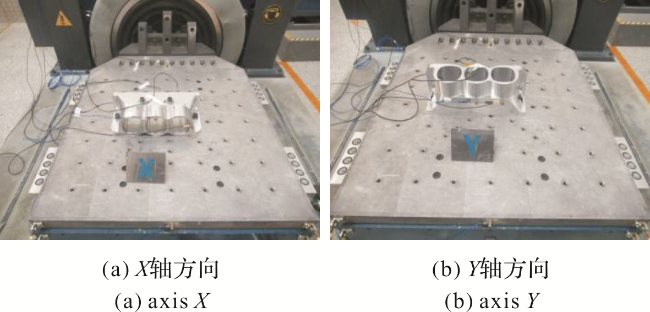
如图20所示,对优化后的振动夹具实物在振动试验台开展随机振动试验,在振动夹具与试验件接口处附近设置测试点,验证其响应特性。
载入与3.4节相同的加速度功率谱密度曲线进行随机振动试验,控制曲线如图21所示,控制曲线稳定且在整个加载频带内都在+3 dB容差范围内,满足试验要求。测试点的响应谱曲线如图21所示,测试点响应试验结果及与仿真结果偏差如表3所示。试验结果表明,X轴向与Y轴向试验功率谱密度响应曲线与仿真响应曲线相差不大,X轴向最大偏差为测试点C的5.6%,在2 000 Hz时响应峰值为0.192 g2/Hz但并未达到共振峰,仍成上升趋势,反应了模态分析的第一阶固有频率2 036.26 Hz;Y轴向最大偏差为测试点D的11.3%,在1 500.0 Hz时响应峰值为1.506 g2/Hz,与模态分析的第一阶固有频率1 578.93 Hz和频响分析的响应峰值1.497 g2/Hz基本吻合,证明了有限元模型的准确性,验证了拓扑优化和参数优化结构的有效性。X轴向试验测试点品质因数最大值为1.506,Y轴向试验测试点品质因数最大值为2.735,表明振动夹具在两个试验方向均具有良好的传递性并满足使用要求。
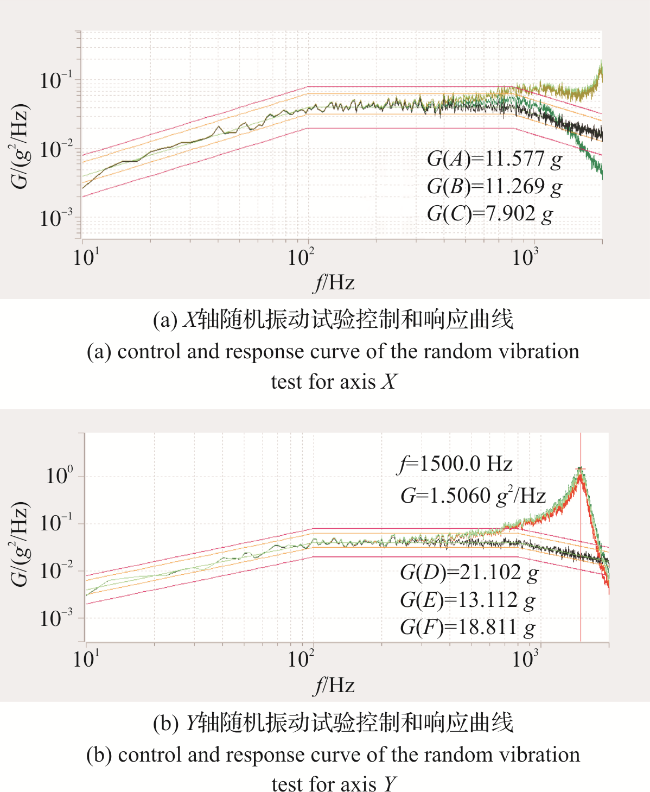


表3 试验结果及与仿真结果偏差Table 3 Experimental results and deviation from simulation results |
| Test point | GRMS/g | Deviation form simulation/% | Q |
|---|---|---|---|
| A | 11.577 | 1.6 | 1.506 |
| B | 11.269 | 1.8 | 1.466 |
| C | 7.902 | 5.6 | 1.028 |
| D | 21.102 | 11.3 | 2.735 |
| E | 13.112 | 6.5 | 1.699 |
| F | 18.811 | 8.5 | 2.438 |
5 结论
针对舵机控制驱动器类产品的随机振动筛选条件综合设计优化典型夹具,并对其进行了预应力模态分析、频响分析、动力学拓扑优化以及多目标参数优化,形成了此类典型夹具的设计流程及方法,完成了随机振动试验验证,证明了设计优化的合理性,主要结论如下。
1)振动夹具结构拓扑优化时,应采用静力响应与动态振动固有频率综合的多目标优化法,目标函数可包括固有频率、静应变能等形式,基于变密度法的SIMP计算模型结合折衷规划法的计算策略可保证优化多目标函数的有效构建。
2)结构预应力模态分析法可以有效地引入振动夹具与振动台间螺栓预紧力工况,其使用的线性摄动法将外载荷引起的变形等效为刚度的改变,从而影响模态,提高计算精度。
3)典型振动夹具综合优化后质量降低32.65%,X轴向第一阶固有频率为2 036.26 Hz,测试点最大品质因数1.506,Y轴向第一阶固有频率为1 578.93 Hz,测试点最大品质因数2.735,因此振动夹具在两个试验方向均具有良好的传递性并满足使用要求。
4)随机振动试验测试点功率谱密度响应曲线与仿真响应点加速度幅频曲线基本吻合,证明了有限元模型的准确性和综合优化设计的有效性。基于CAD和CAE协同仿真技术的振动夹具综合优化设计能够预测夹具结构的动态特性,可以显著提高其设计效率和可靠性,提升夹具的综合性能,保障舵机驱动器类电子产品的高质量研发和生产。