

0 引言
近年来以“布拉莫斯”、“雄风-Ⅲ”为代表的超音速巡航导弹凭借低空超音速突防能力对我国防空武器造成较大威胁。为模拟相关目标特性以便军方开展红蓝攻防演训,有必要研制具备巡航速度不小于2Ma、巡航高度低于250m飞行能力的低空超音速巡航靶弹。当前市场上满足上述指标要求的某型靶弹采用火箭助推和冲压发动机的动力形式,但其定价高昂难以在演训市场推广应用。这是由于冲压发动机成本高昂、技术难度大,而端燃发动机凭借低成本、高技术成熟度,以及对低海拔空域内端燃发动机推力不可调劣势的有效规避,可作为冲压发动机的低成本替代。
本文采用侧燃大推力固体火箭发动机作为靶弹助推推力、端燃固体火箭发动机作为低空靶弹巡航推力[1-4],这种多级固体火箭发动机的动力形式可显著降低靶弹成本,适应市场需求。在此基础上,需要设计靶弹总体参数使得其低空超音速巡航供靶时间最长、性能最优。传统的设计方法是将靶弹总体设计优化与发动机设计优化作为串行流程,通过靶弹总体参数优化、发动机最优原则设计、弹道指令优化等步骤开展设计迭代,使得设计周期较长,设计响应较慢。为解决上述问题,本文通过选取部分靶弹总体参数,依据固体火箭发动机内弹道模型建立发动机结构、推力和质量参数化模型,以此作为输入开展外弹道仿真,从而完成内外弹道模型耦合,并以靶弹巡航时间为目标函数开展内外弹道联合仿真寻优设计[5-9]。
1 数学模型
1.1 固体火箭发动机性能分析模型
1.1.1 内弹道模型
Vr、Pr、Tr——燃烧室容积、压强、温度;
ρp——推进剂密度;
Ab、At——药柱燃面、喷喉面积;
r——装药燃速;
R——燃烧室气体常数;
Γ、k——燃气比热比函数、燃气比热比;
χ、φ2——热损失修正系数、喷管流量修正系数;
当燃烧室内气体燃烧处于平衡状态时,燃烧系统对于平衡被破坏后自动回复到平衡状态所需时间很短,因此可以近似认为该状态的燃烧室压强即为瞬时平衡压强,此时可推导得压强如下:
C*——特征速度;
假设燃烧室气体在喷管中进行一维等熵膨胀,可以得到尾喷管出口喷气速度如下:
ve=
ve——喷口气体速度;
Pe——喷口处压强;
喷口处压强可根据喷管扩张比计算:
固体火箭发动机通过尾喷管出口喷气产生反作用推力,根据动量守恒得到发动机推力如下:
F= ·ve+(Pe-Pa)·Ae
对于端燃发动机,端燃燃烧时长如下:
t=lb/r
对于侧燃发动机,侧燃燃烧时长如下:
t=(d1-d2)/(2·r)
1.1.2 发动机质量特性模型
固体火箭发动机由发动机壳体、药柱、绝热层、喉衬、尾喷管扩散段等组成:点火机构、连接组件等结构的质量特性依据经验值估算;发动机壳体、药柱、绝热层可根据靶弹总体尺寸参数结合几何模型求解公式求解质量质心及转动惯量参数;尾喷管质量特性通过建立喷管参数化模型进行求解[15]。
1)壳体模型
发动机壳体一般采用前后接头和圆筒段焊接形式,前后接头采用厚壁钢管加工成椭球形。根据工程经验,圆筒段最小厚度δy采用薄壁筒体的第四强度理论计算得到,前后接头最小厚度δj采用最大应力强度理论,计算公式如下:
δj、δy——圆筒段最小厚度,前后接头最小厚度;
p'm——壁厚计算压强;
re——壳体内部半径;
tj——封头面椭球比;
[σ]——壳体许用应力;
k——压强安全系数;
Pmax——燃烧室最大压强;
σs——壳体材料屈服强度;
ψ——焊缝修正系数;
ns——安全系数。
选取壳体材料,依据壳体厚度、外径、裙间距即可求解发动机壳体质量质心转动惯量。
2)尾喷管模型
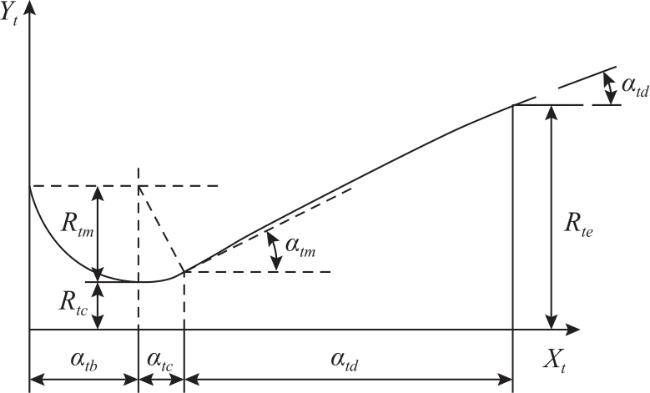
Xt——尾喷管曲线到喷管前端面位移;
Yt——尾喷管曲线到喷管轴线位移;
atb、atc、atd——尾喷管收敛、过渡、扩张段长度;
Rtc、Rte、Rtm——尾喷管喉部、出口、过渡段半径;
αtm、αtd——尾喷管扩张段进出口扩张半角;
依据第四强度理论计算得到尾喷管最小厚度,结合尾喷管曲线可求解尾喷管质量质心转动惯量。
1.2 靶弹外弹道仿真计算模型
1.2.1 靶弹运动模型
在总体方案设计优化阶段,为获得飞行弹道及主要飞行特性参数,将靶弹简化为可操纵质点建立运动模型如下:
m、P、G——靶弹质量、推力、重力;
V、θ、ψ——靶弹速度、弹道倾角、弹道偏角;
X、Y、Z——靶弹气动阻力、升力、侧向力;
α、β、γ——靶弹攻角、侧滑角、速度倾斜角;
x、y、z——靶弹发射系三坐标方向位移;
本文采用过载指令,这种指令对应的输出过载是与弹轴垂直的法向过载,攻角、侧滑角可根据靶弹需用法向过载求解:
αϕ、ϕ——合成攻角、气流偏斜角;
ny1a、nz1a——靶弹执行系Y向、Z向过载;
q——动压;
S——靶弹参考面积;
、 ——靶弹升力系数对攻角、舵偏的偏导数;
、 ——靶弹Z向力矩系数对攻角、舵偏的偏导数;
质点弹道舵偏根据瞬时平衡假设求解:
δϕ——合成舵偏;
δp、δy——俯仰通道舵偏、偏航通道舵偏。
1.2.2 弹道指令模型
为降低靶弹成本,助推段采用尾翼无控形式,主级采用修正比例导引追踪虚拟目标的制导律模型。
1)虚拟目标设计
虚拟目标设计包括初始目标点设计以及目标位移设计,应使得靶弹在给定的高度上有尽可能长的巡飞段,同时需满足平飞的高度精度以及降低过渡段所需的靶弹法向过载。本文设计初始目标点如下:
Dx0——初始射向弹目距离;
ψsxj——射向角;
ym_xh——靶弹巡航高度;
xt0、yt0、zt0——初始目标点坐标;
实时虚拟目标位置根据靶弹实时位置与实时弹目相对距离合成得到。本文通过增大初始射向弹目距离降低过渡段过载,到达巡航高度附近缩小弹目距离以保证靶弹平飞后能够较好的追踪虚拟目标并维持平飞的高度精度。为保证过渡平滑,本文采用指数形式的x轴弹目距离变化函数:
Δxm=
Δxm、Δ ——实际弹目距离、弹目距离基准;
vm、v'm——靶弹飞行速度、跟踪基准弹目距离速度;
Tgd—过渡段结束时间;
2)弹目相对运动模型
通过相对位移和相对角度描述靶弹与虚目标之间的位置关系如下:
r、 ——弹目距离、弹目距离变化率;
Vm、θm——靶弹速度、弹道倾角;
Vt、θt——虚拟目标速度、弹道倾角;
q、 ——弹目视线角、视线角速度;
3)导引规律
本文采用附加重力修正项的比例制导律作为靶弹导引规律,设计弹道倾角变化率正比于视线角速度实现弹目追踪。制导律方程如下:
=An| | +Bn·cosm
An、Bn——比例系数。
1.3 模型验证
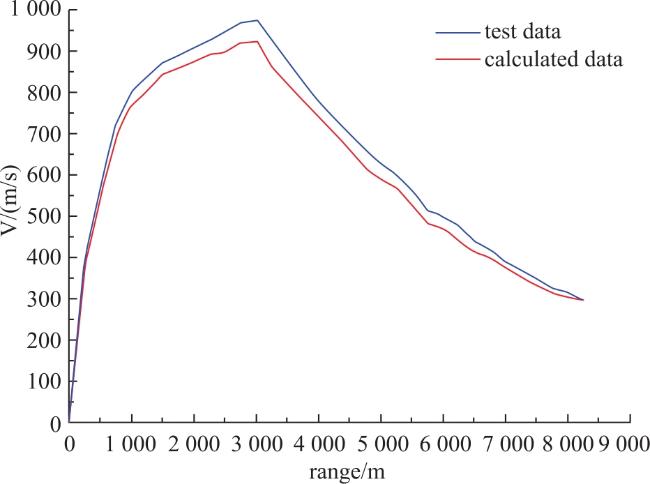
为验证上文固体火箭发动机内弹道模型与靶弹外弹道计算模型的可靠性,通过对比文献[17]中的试验数据及理论计算结果,对模型精度进行分析。
1.3.1 内弹道模型验证
表1 发动机内弹道参数对比Table 1 Comparision of internal ballistic parameters of engines |
| project | literature data | calculated data | error | |
|---|---|---|---|---|
| booster engine | pressure | 11.34MPa | 10.87MPa | -4.14% |
| thrust | 32.28KN | 32.03KN | -0.77% | |
| time | 2.784s | 2.77s | -0.50% | |
| cruise engine | pressure | 4.12MPa | 4.07MPa | -1.21% |
| thrust | 10.4KN | 9.89KN | -4.90% | |
| time | 2.9736s | 2.94s | -1.13% | |
通过与文献[17]理论数据对比发现,发动机内弹道参数误差均在5%以内,该误差主要由用于零维内弹道修正的热损失修正系数及喷管流量修正系数选取偏差引起,可以满足方案设计阶段快速优化需求。
1.3.2 外弹道模型验证
2 多级推力靶弹内外弹道仿真优化
2.1 优化模型
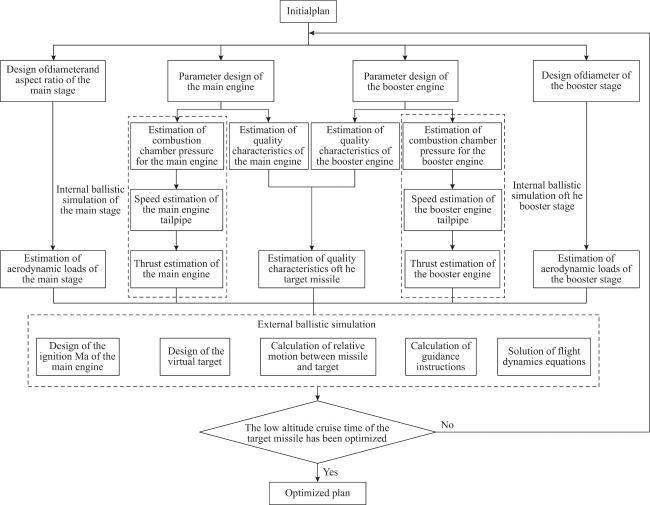
为使得多级靶弹低空巡航性能最优,应将两级发动机的能量分配、质量分配、点火时间同靶弹飞行弹道计算结合起来,通过内外弹道联合仿真优化获得靶弹总体参数和发动机参数的最优值。
2.1.1 目标函数
为更好地模拟“布拉莫斯”、“雄风-Ⅲ”的低空突防运动特性,靶弹应实现2Ma巡航速度、200m巡航高度这一典型工况的最优巡航能力,即有尽可能长的巡航时间和巡航距离。因此本文以两级动力系统靶弹的低空超音速巡航供靶时间最大作为优化目标。
2.1.2 设计变量
为开展靶弹内外弹道特性计算,需通过设计变量描述靶弹气动特性、质量特性、发动机质量特性、发动机推力特性等。本文选取部分靶弹几何参数及发动机总体参数共16个设计变量,见表2所示,通过上文数学模型解算得内弹道特性及靶弹质量特性参数,以此作为外弹道仿真输入。
表2 内外弹道联合仿真优化设计变量Table 2 Design variables for joint internal and external ballistics simulation and optimization |
| No. | Parameter name | Sym. |
|---|---|---|
| 1 | Diameter of the target missile’s main stage | D1 |
| 2 | The aspect ratio of the target missile’s main stage | ld1 |
| 3 | Thickness of the main engine casing | δ1 |
| 4 | The group spacing of the main engine | l1 |
| 5 | Diameter of nozzle of the main engine | dcr1 |
| 6 | The combustion rate of the main engine | r1 |
| 7 | The length of the main engine tailpipe | l11 |
| 8 | Diameter of the main engine tailpipe | Dp1 |
| 9 | The ratio of the diameter of the booster stage and the main stage | D21 |
| 10 | Thickness of the booster engine casing | δ2 |
| 11 | The group spacing of the booster engine | l2 |
| 12 | Diameter of nozzle of the booster engine | dcr2 |
| 13 | The combustion rate of the booster engine | r2 |
| 14 | The length of the booster engine tailpipe | l22 |
| 15 | Diameter of the booster engine tailpipe | Dp2 |
| 16 | The ignition Ma of the main engine | Ma1 |
2.1.3 约束
在设计变量进行搜索仿真过程中,需满足靶弹总体布局需求、结构可靠性以及飞行稳控性能等约束,本文将上述指标转化为约束不等式引入优化程序中:
1)通过燃烧室压强结合第四强度理论计算得到主级发动机壳体厚度最小值:δ1≥δ1min;
2)同理对于助推发动机壳体厚度有:δ2≥δ2min;
3)为保证靶弹设备、任务载荷布局空间,对靶弹飞控舱长度约束:lfk(D1,ld1,l1,l11)≥lfkmin;
4)为保证舵机舱设备布局空间,对主级喷口直径约束:Dp1≥Dp1min;
5)为保证靶弹飞行稳控特性,对靶弹静稳定裕度进行约束: ≥ ;
6)为保证主级药柱力学特性,对其长细比进行约束:k1min≤ly(l1)/Dy(D1,δ1)≤k1max;
7)同理,对助推药柱长细比约束:k2min≤ly2(l2)/Dy2(D21,δ2)≤k2max。
综上得到优化数学模型如下:
F(X)——目标函数,即靶弹低空巡航时间;
X、Xmin、Xmax——16个设计变量、变量最小值、变量最大值;
G(X)、Gmin、Gmax——7个约束条件、约束最小值、约束最大值。
2.2 优化算法及流程
3 优化算例及分析
3.1 优化算例
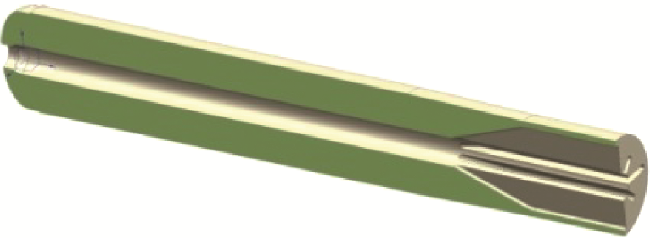
根据本文建立的优化算法及流程,结合内外弹道解算数学模型对某型低空超音速巡航靶弹进行设计寻优。靶弹动力系统采用主级端燃固体火箭发动机和助推侧燃固体火箭发动机的形式,靶弹控制系统采用助推段旋转尾翼无控和主级电动舵系统控制形式。
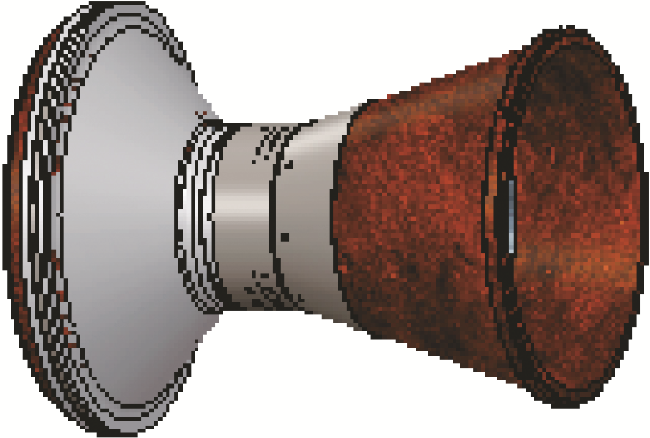
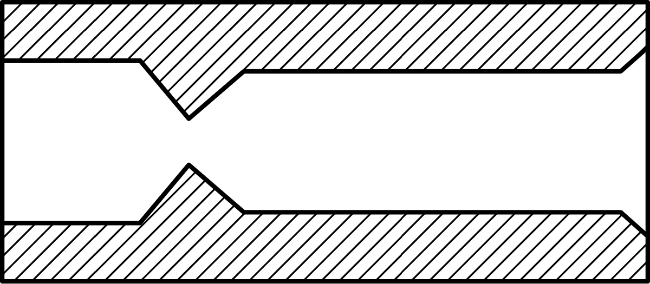
靶弹设计变量优化搜索范围及初始值见表3。
表3 设计变量优化搜索范围及初始值Table 3 Search range and initial value of variables |
| Variable | Lower limit | Initial value | Upper limit |
|---|---|---|---|
| D1/m | 0.21 | 0.214 | 0.3 |
| ld1 | 19 | 19.2 | 20 |
| δ1/m | 0.001 | 0.0013 | 0.002 |
| l1/m | 2.2 | 2.6 | 3.7 |
| dcr1/m | 0.02 | 0.022 | 0.04 |
| r1/(m/s) | 0.03 | 0.037 | 0.05 |
| l11/m | 0.2 | 0.27 | 0.4 |
| Dp1/m | 0.08 | 0.09 | 0.13 |
| D21 | 1.2 | 1.6 | 2 |
| δ2/m | 0.002 | 0.0029 | 0.004 |
| l2/m | 1.6 | 2 | 2.8 |
| dcr2/m | 0.065 | 0.073 | 0.1 |
| r2/(m/s) | 0.016 | 0.018 | 0.02 |
| l22/m | 0.3 | 0.35 | 0.4 |
| Dp2/m | 0.19 | 0.23 | 0.33 |
| Ma1 | 1.8 | 2 | 2.2 |
3.2 优化结果与分析
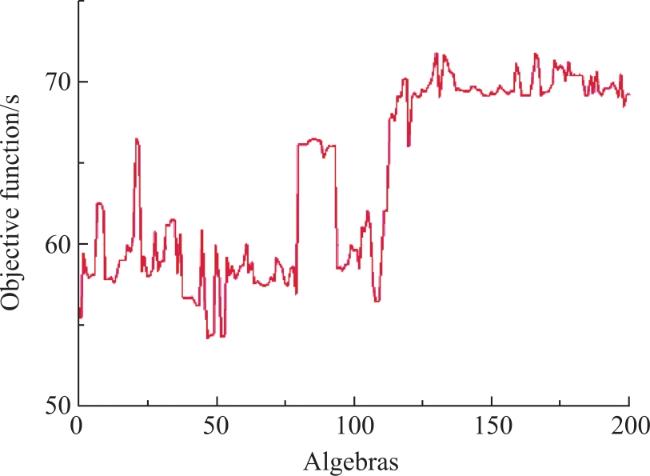
表4 初始方案与优化后方案对比Table 4 Comparison between initial and optimized plan |
| Variable | Initial | Optimized |
|---|---|---|
| D1/m | 0.214 | 0.28 |
| ld1 | 19.2 | 19.15 |
| δ1/m | 0.0013 | 0.0018 |
| l1/m | 2.6 | 3.64 |
| dcr1/m | 0.022 | 0.027 |
| r1/(m/s) | 0.037 | 0.049 |
| l11/m | 0.27 | 0.34 |
| Dp1/m | 0.09 | 0.1 |
| D21 | 1.6 | 1.6 |
| δ2/m | 0.0029 | 0.0036 |
| l2/m | 2 | 2.63 |
| dcr2/m | 0.073 | 0.083 |
| r2/(m/s) | 0.018 | 0.017 |
| l22/m | 0.35 | 0.34 |
| Dp2/m | 0.23 | 0.3 |
| Ma1 | 2 | 1.97 |
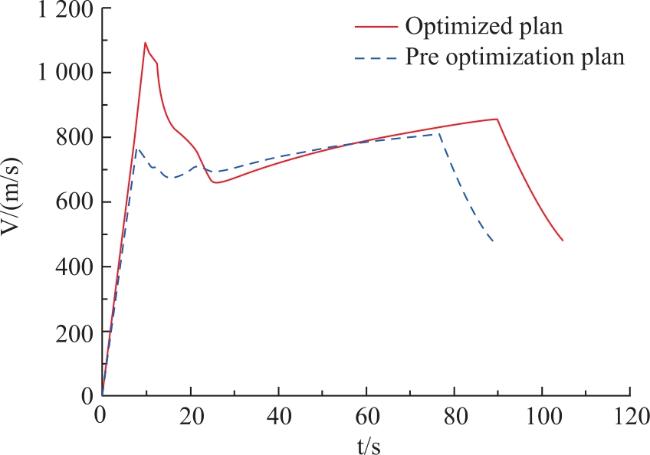
| Objective function/s | 56.34 | 71.8 |
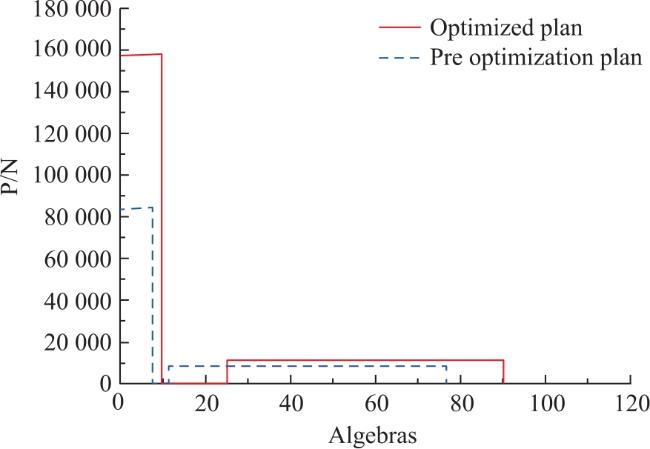
图9 优化前后发动机推力曲线对比图Fig.9 Comparison of engine thrust curves before and after optimization |
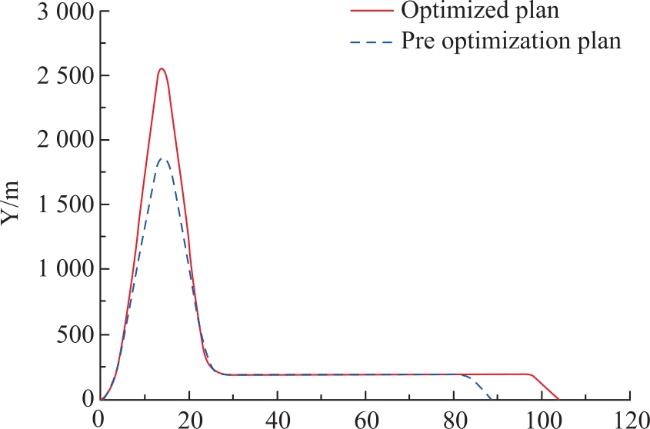
图10 优化前后高度时间曲线对比图Fig.10 Comparison of height-time curves before and after optimization |


4 结论
针对多级推力靶弹巡航性能设计优化迭代次数多、周期长的问题,构建了内外弹道一体化寻优方案,开展多级推力靶弹低空超音速巡航性能优化研究,得出如下结论:
1)提出了一种多级推力靶弹内外弹道耦合方案优化框架,建立了固体火箭发动机性能分析模型和靶弹外弹道仿真计算模型,通过遗传算法求解得到靶弹供靶性能最优方案。
2)建立了内外弹道联合设计寻优流程。与传统的靶弹总体和动力系统串行设计并不断迭代优化方案相比,本方案通过一次寻优实现设计优化快速收敛,提高了低空超音速巡航靶弹寻优效率。
3)开展了低空超音速巡航靶弹巡航时间的优化研究,在发动机结构强度、药柱力学特性、舱体总体布局以及靶弹稳控特性约束下,优化方案相比初始方案实现巡航时间提升27.4%。